Overview
Install a web-based application that provides an Out of Box Experience to securely connect your Intel device to Azure* IoT Hub or Azure* IoT Central†. The web application creates Azure IoT Resources and enables configuration and monitoring of Edge AI and use case deployments.
Select Configure & Download to download the use case.
Target System Requirements
- Intel® CPU Processors
- Intel® Atom* processor with Intel® SSE4.1 support
- Intel® Pentium® processor N4200/5, N3350/5, N3450/5 with Intel® HD Graphics
- 6th - 12th generation Intel® Core™ processors
- Intel® Xeon® processor E3, E5, and E7 family
- 2nd Generation Intel® Xeon® Scalable Processors
- 3rd Generation Intel® Xeon® Scalable Processors
- At least 4 GB RAM.
- At least 64 GB hard drive.
- An Internet connection.
- Ubuntu* 18.04.3 LTS Kernel 5.0
- Microsoft Windows* 10 IoT Enterprise Version 10.0.19044 or above [if using Azure IoT Edge for Linux on Windows* (EFLOW)]
NOTE: If you want to run the Out-of-Band Manageability application, you must use an Intel vPro® Platform. Refer to the OOB-specific Target System Requirements in this article for details.
Knowledge/Experience
You should be or you are expected to be familiar with executing Linux* commands.
How It Works
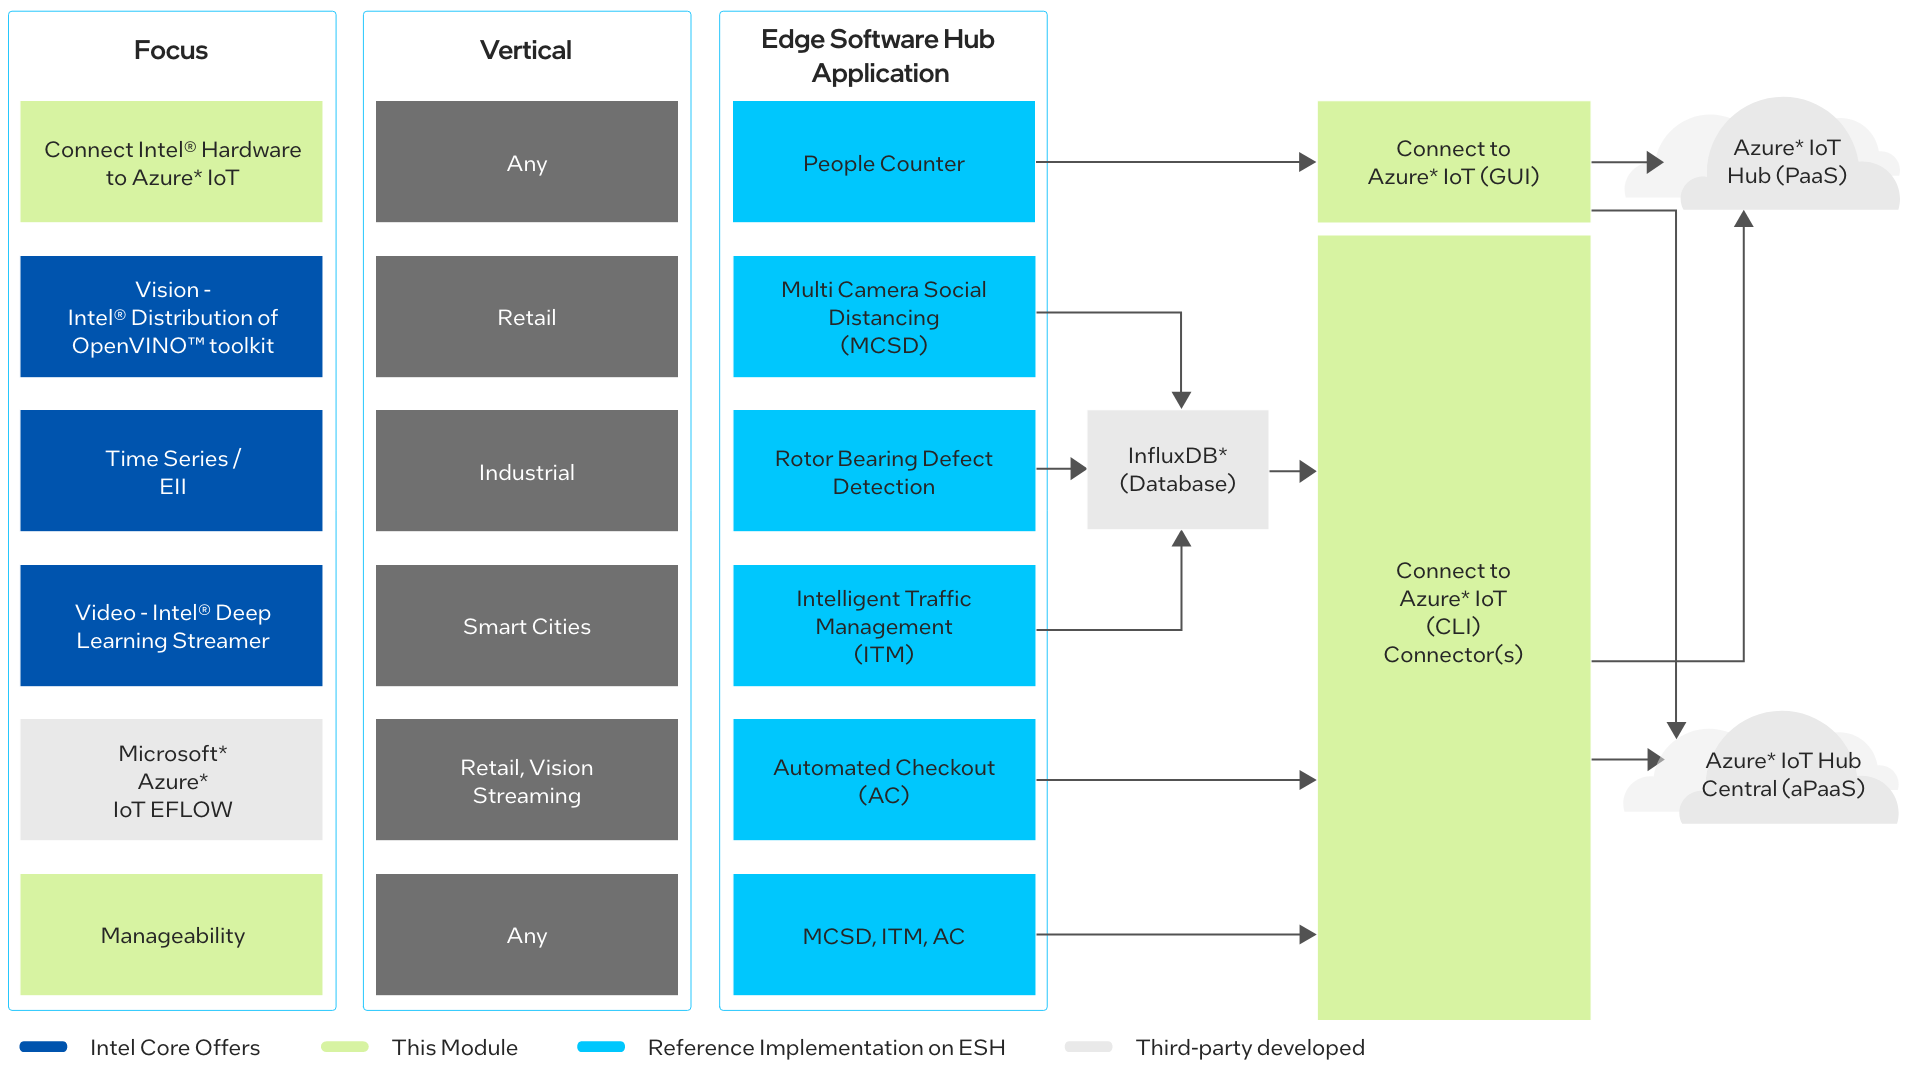
The primary goal of the use case is to demonstrate the Connectivity to Azure IoT module, which provides several methods of connecting to Azure IoT. The use case also includes a collection of solutions you can use with Azure IoT.
The below diagram lists the use case examples in the ESH Application column and shows how they interact with the Connectivity to Azure IoT module.
The Connect Intel Devices to Azure IoT* web application deploys Azure IoT Edge modules to edge devices with the following steps:
- Setup Device.
- Create and setup Azure IoT Resources:
- Resource Group (RG): A new approach to group a collection of assets in logical groups for easy, or even automatic provisioning, monitoring, and access control, and for more effective management of their costs.
- Azure IoT Central: Microsoft* IoT application development platform that connects IoT devices to the cloud. Provides basic pre-integrated Azure Services such as device provisioning, streaming analytics and time series insights. Use Microsoft’s Software-as-a-Service Azure IoT Central platform to quickly connect an Intel device to visualize, maintain and deploy your IoT solution.
- Azure IoT Hub: Microsoft’s IoT connector to the cloud. It enables reliable and secure bi-directional communications between millions of IoT devices and a solution back end. If you have your own Platform-as-a-Service (PaaS), use an Intel device connected to Azure IoT Hub to complete the edge-to-cloud IoT Solution.
- IoT Edge Device: An IoT Edge is a smart device equipped with compute power and designed to execute services in the field.
- Configure config.yaml for secure connection with connection string.
- Restart the IoT Edge daemon.
- Set module in Azure portal and then deploy.
Once the above-mentioned steps are complete, the Edge device is ready to deploy IoT modules.
How to Navigate this Guide
If you are a beginner user, we recommend that you follow all the steps in the Get Started section and run the People Counter Example to use a GUI-based approach:
- SimulatedTemperature, an Azure Marketplace application.
- PeopleCounter, an OpenVINO™ toolkit reference application.
If you are an experienced user, follow Step 1 through Step 6 in the Get Started section. Then you can use the connect scripts in any of the reference implementations in the Additional Examples section of this guide:
- Automated Checkout Reference Implementation.
- Intelligent Traffic Management Reference Implementation.
- Social Distancing Detection for Retail Settings Reference Implementation.
- Rotor Bearing Defect Detector Reference Implementation.
Connecting to Azure IoT Hub or Azure IoT Central
If you have your own Platform-as-a-Service, use the Intel Device connected to IoT Hub to complete the edge-to-cloud IoT Solution.
If you do not know where to start on the Cloud, you can use the Microsoft* aPaaS Azure IoT Central platform to quickly connect Intel device to visualize, maintain and deploy your IoT solution.
Read the 8 attributes of successful IoT solutions for more information on when to use Azure IoT Hub or Azure IoT Central.
Get Started
Step 1: Install the Use Case
Select Configure & Download to download the use case and then follow the steps below to install it.
During installation, you will be prompted to enter your Product Key. This key is in the email you would have received from the Intel® Registration Center. Contact Support Forum if you do not have this email message.
The steps below explain how to:
- Prepare your target system.
- Copy the package.
- Complete the installation steps.
Step 2: Prepare the Target System
Make sure your target system has a fresh installation of Ubuntu, if you need help installing Ubuntu follow these steps:
-
Download the Ubuntu Desktop ISO file to your developer workstation.
-
Create a bootable flash drive using an imaging application, such as Startup Disk Creator, available on Ubuntu.
-
After flashing the USB drive, power off your target system, insert the USB drive, and power on the target system.
If the target system doesn't boot from the USB drive, change the boot priority in the system BIOS.
-
Follow the prompts to install Ubuntu with default configurations. For detailed instructions, see the Ubuntu guide.
-
Power down your target system and remove the USB drive.
-
Power up the target system. You will see Ubuntu Desktop is successfully installed.
Step 3: Copy the connect_devices_to_azure_iot.zip File to the Target System
In this step you copy the connect_devices_to_azure_iot to your Target System.
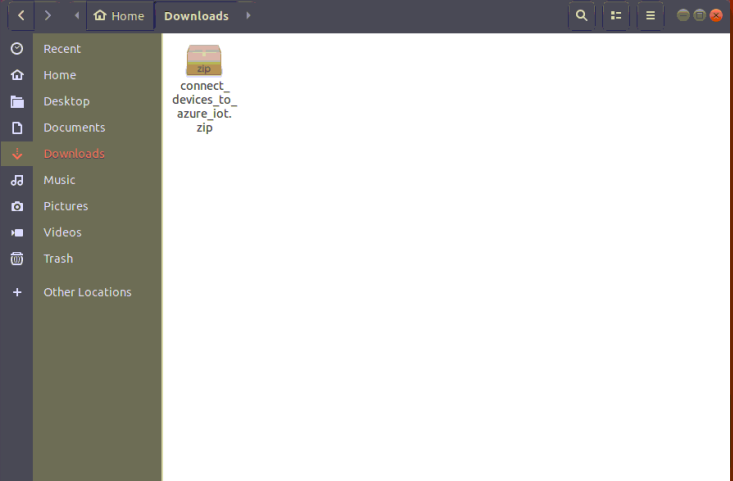
1. Copy the connect_devices_to_azure_iot.zip file from the developer workstation to the Home directory on your target system. You can use a USB flash drive to copy the file. The icon looks like this:
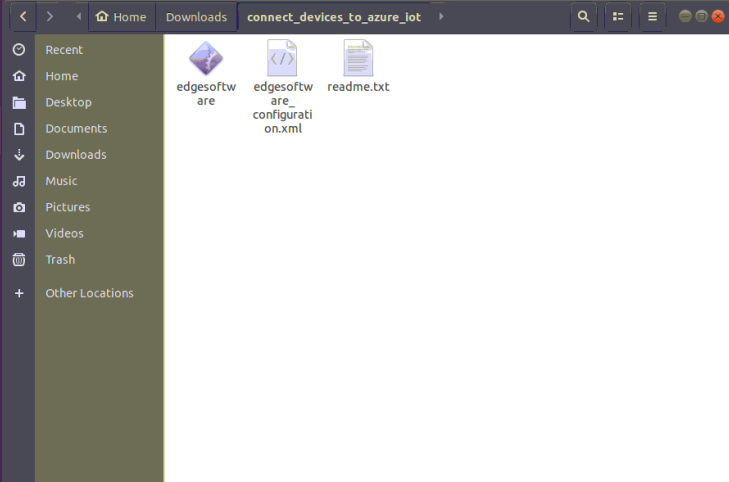
Step 4: Extract the Software
In this step you extract connect_devices_to_azure_iot.zip. You need to be on the target system to complete these steps.
-
Make sure you have a working Internet connection.
-
Open a new terminal.
-
Extract the package:
unzip connect_devices_to_azure_iot.zip
NOTE: If you download the connect_devices_to_azure_iot.zip more than once, each download beyond the first will be appended by a number.
-
(Optional) Use the link in the readme file to open this Get Started Guide on the target system for an easy way to copy and paste commands.
Step 5: Install the connect_devices_to_azure_iot
You will now run a script that will download components and install connect_devices_to_azure_iot on your target system.
The software installation will take approximately 30 mins. The completion time depends on your target system and Internet connection.
-
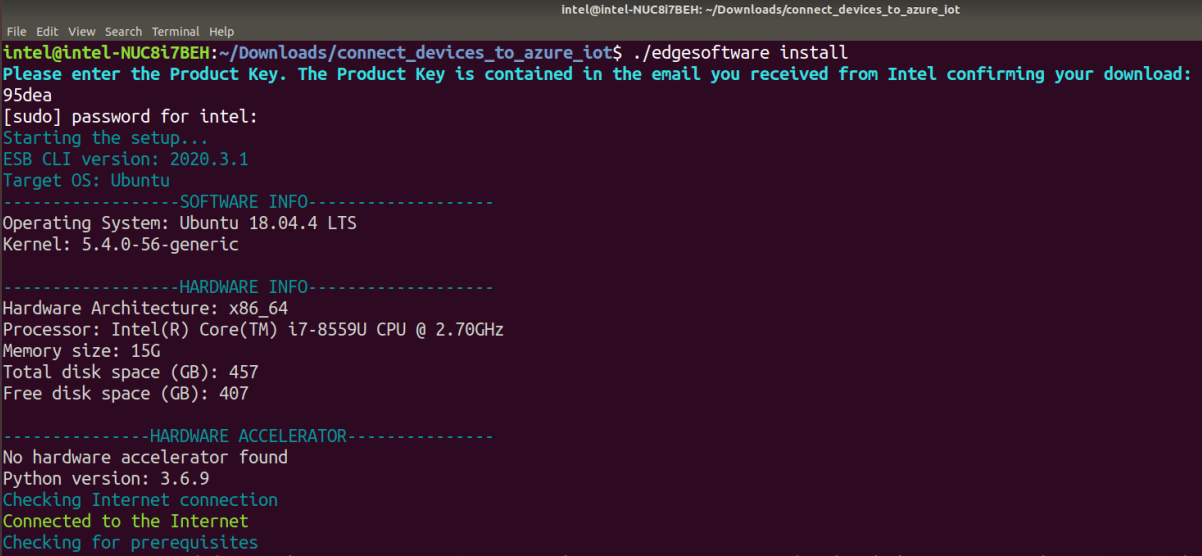
Run these commands:
cd connect_devices_to_azure_iot /

chmod 775 edgesoftware

./edgesoftware install
-
Type the product key at the prompt:
-
Based on components selected and system configuration, you might be prompted for additional actions. For example, if your system is behind a proxy, you are asked to enter proxy settings.
When the installation is complete, you see the message Installation of package complete and the installation status of each module.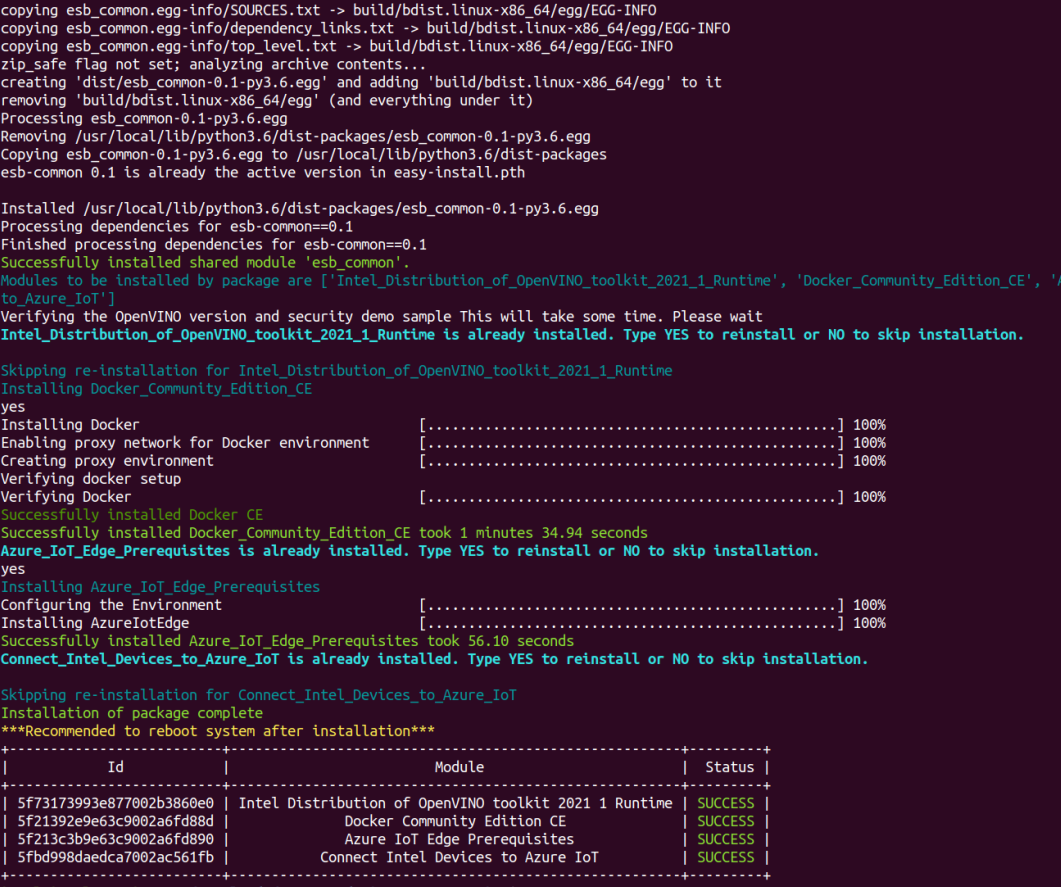
NOTE: Versions for Intel® Distribution of OpenVINO™ toolkit will vary from what is shown above.
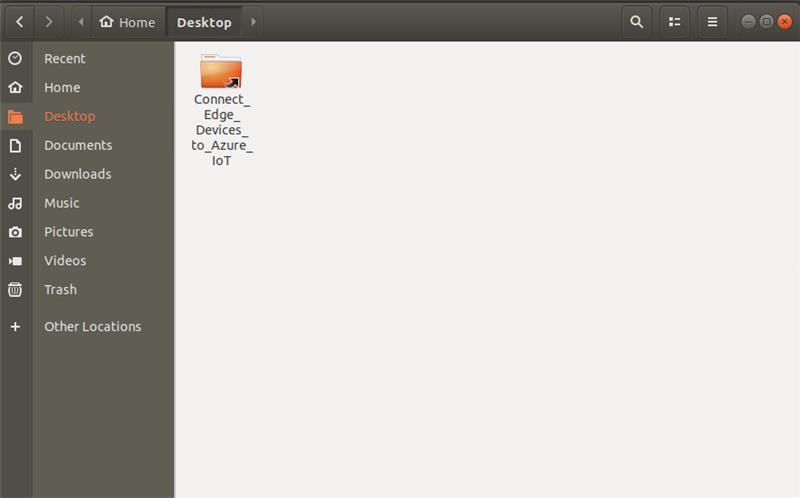
4. After successful installation, a shortcut will be available on the Desktop.
Step 6: Create a Microsoft Azure Account
1. If you do not have a Microsoft Azure account, click on the sign-up link provided in the web page and create an account.
2. If you do have an account, or after you have created an account, click Next to proceed and follow the below steps:
NOTE: Make sure your subscription is registered to “Microsoft.Devices”. Please follow this Azure link.
3. Follow as mentioned in the screen below:
4. Copy the code from the terminal as shown below and proceed with the steps in the browser.
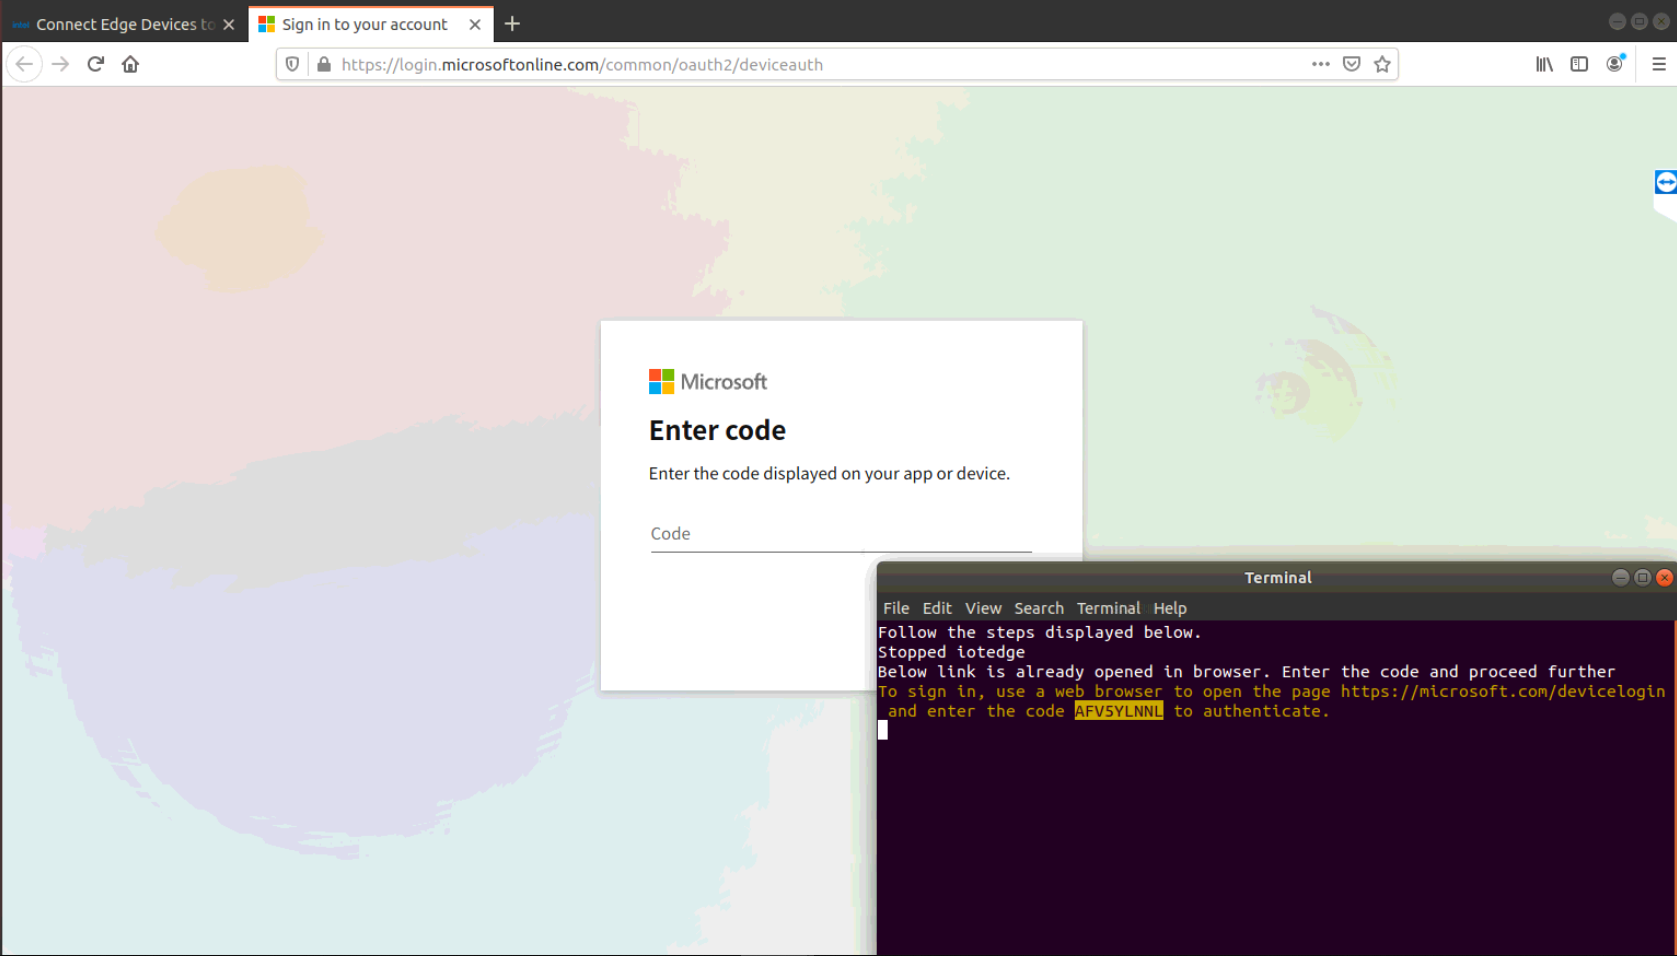
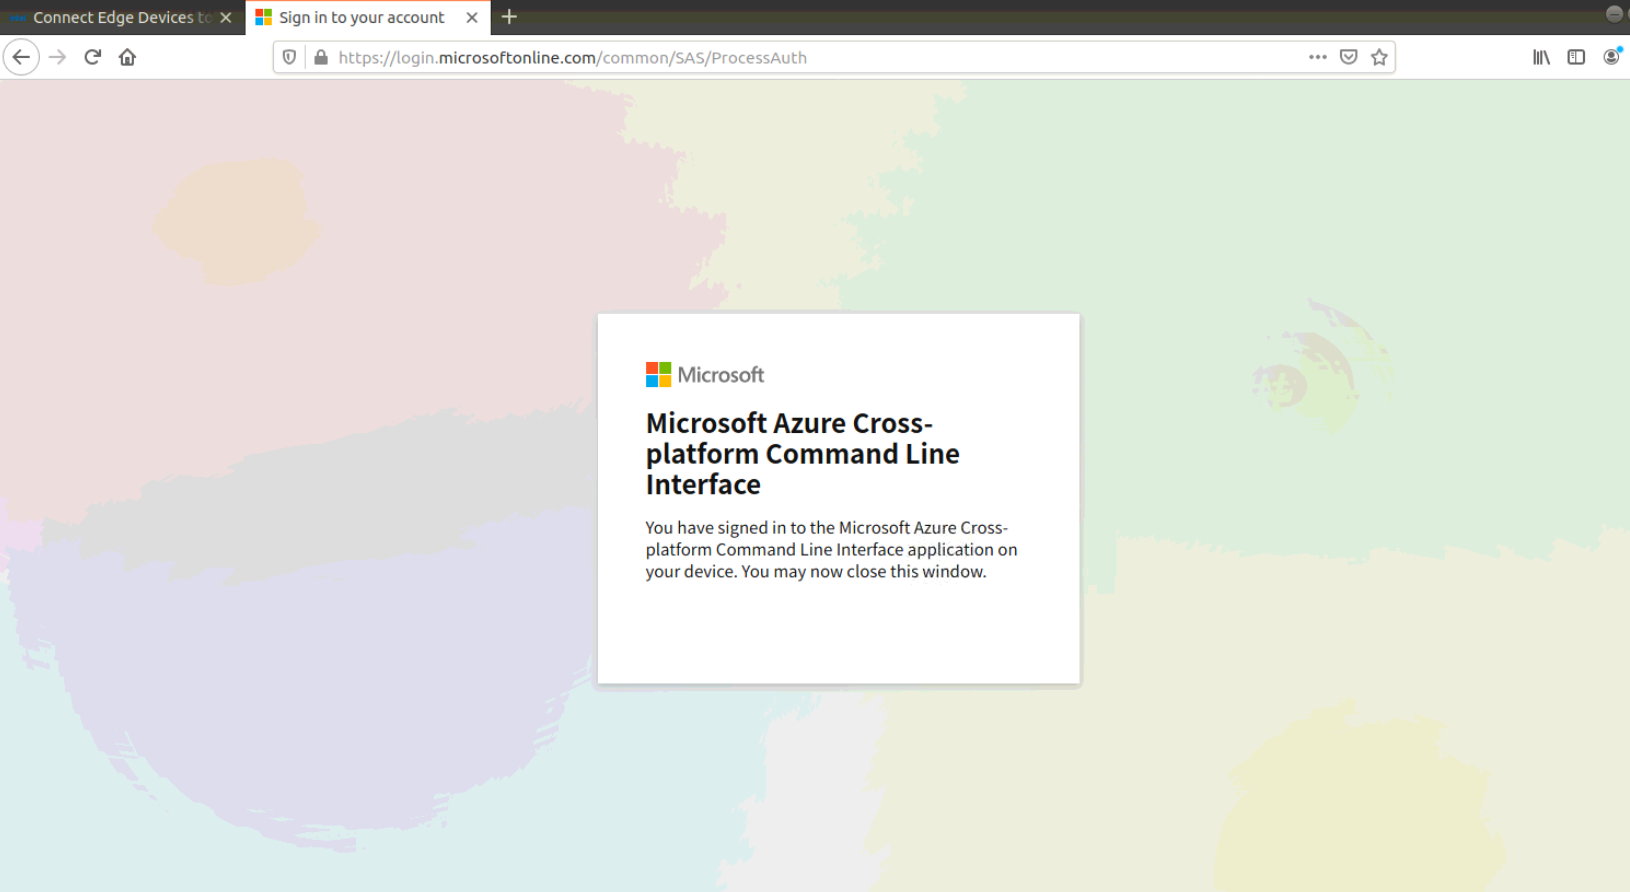
5. After signing in, close the page and return to the Connect Edge Devices to Azure IoT page to proceed with Azure login.
If you are a beginner user, continue to the People Counter example.
NOTE: If you are an experienced user, you can use the connect scripts in any of the reference implementations in the Additional Examples section of this guide.
People Counter Example
This section explains how to use the People Counter example, which is a simple example for beginners using the GUI interface.
If you are an experienced user, you can use the connect scripts in any of the reference implementations in the Additional Examples section of this guide.
Build People Counter Docker Image
In the next series of steps, you are going to build the People Counter docker image. Once the image is created, it will be pushed into the Azure Container Registry.
These steps assume you have completed Steps 1 through 6 in the Get Started section above.
1. For creating an Azure container registry, use the following link: Creating a container registry.
2. Go to ~/Desktop/Connect_Edge_Devices_to_Azure_IoT/Cloud/People_Counter_App folder in your machine.
3. Build the People Counter docker images:
sudo docker build . -t <image URL>:<tag>
[ Ex: docker build . -t abc.azurecr.io/peoplecounter:1.0 ]
NOTE:
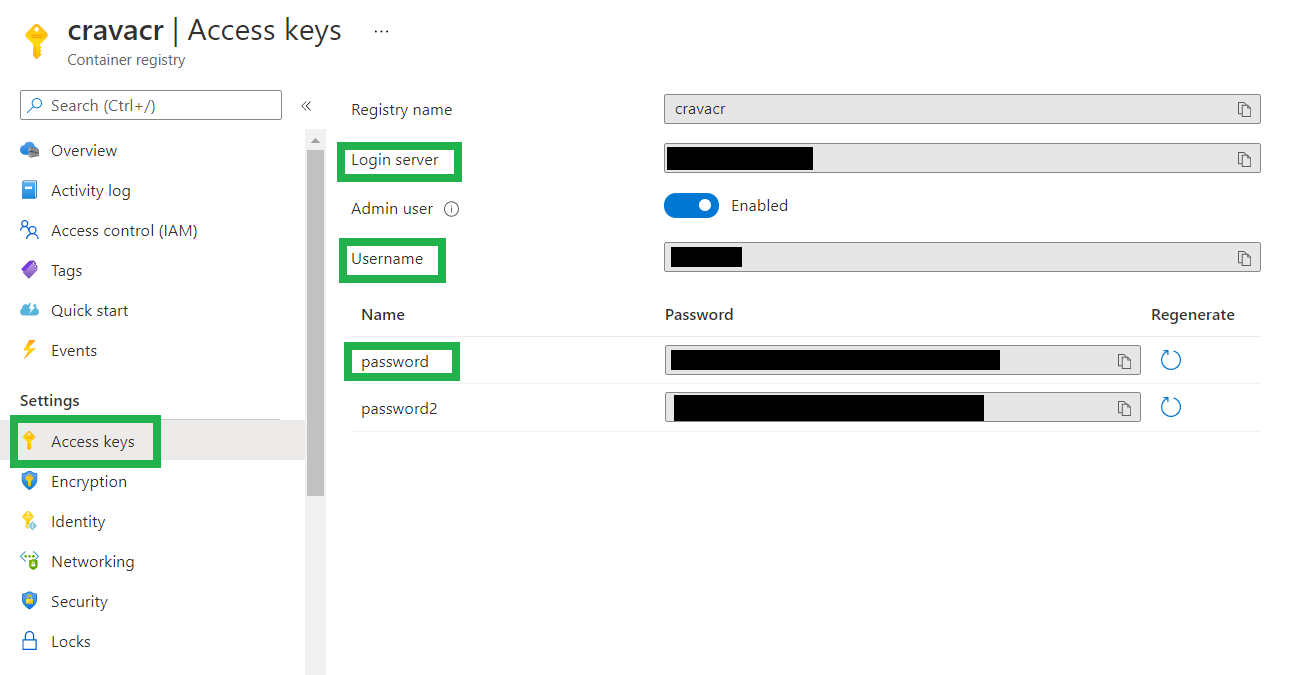
a. For creating image URL, you need login server details of your container registry. Go to Azure portal > container registry > choose your container registry > Access keys. Make a note of 'Login Server' details to create image URL.
b. Image URL should correspond to your Azure container registry. For example, abc.azurecr.io/peoplecounter:1.0. Where abc.azurecr.io is the login server address of your container registry, peoplecounter is your repository and 1.0 is the image tag.
c. Make a note of your image URL for further steps.
d. Building Docker image will take 10-25 minutes depending on your internet connection speed.
4. Login to your repository to pull the image:
sudo docker login -u <Azure CR username> -p <Azure CR password> <Azure CR login>
NOTE: CR is the Container Registry.
Example: sudo docker login -u XXXXX -p XXXXXXXXXXXXXPb8l XXXXX.azurecr.io
5. Go to Azure portal > container registry > choose your container registry > Access Keys. Enable Admin user and get the details of Container registry and please make a note of Username, password and Login server for further steps.
6. Push the application image to your Azure container registry:
sudo docker push <image URL>:<tag>
Example: sudo docker push abc.azurecr.io/peoplecounter:1.0
Prepare the Deployment Manifest
In the next series of steps, you prepare the deployment manifest file. Deployment manifest is used to configure and deploy modules to IoT Edge device from Azure IoT Hub/IoT Central.
1. Go to ~/Desktop/Connect_Edge_Devices_to_Azure_IoT/Cloud/Deployment_Manifest in your target system and open the deployment.json file.
2. Provide the People Counter Docker image URL (line no.8).
Example: abc.azurecr.io/peoplecounter:1.0
3. Replace container registry name (line no.32), login server (address: line no.33), password (line no.34) and username (line no.35) of your container registry created in previous step.
NOTE: Give full image url with tag. [ Example: abc.azurecr.io/peoplecounter:1.0 ]
4. Go to Azure portal -> container registry -> choose your container registry -> Access Keys. Get the details of container registry Username, login and password.
5. Optional Steps:
- Change Video Source: Set the value of VIDEO_INPUT environment variable in line no. 20
| Type | Value | Remark |
|---|---|---|
| Video FIle | /home/application1/resources/<video file> | Make sure you have placed video file inside /application1/resources folder before building docker image. |
| USB Camera | CAM | Make sure physical camera is connected to system |
| RTSP Stream | RTSP URL | Example: rtsp://10.0.4.165:554/media/camera-300s.mkv |
- Change Inference Device: Set the value of DEVICE environment variable in line no. 23. Supported hardware devices are CPU, GPU, HDDL* and MYRIAD*
NOTE: HDDL-R and MYRIAD are not tested and validated, so this may not work.
- Set Display Environment Variable: Value of DISPLAY environment variable (line no.17) of container should be same as that of host machine.
- Change Restart Policy: Set restart policy (line no.13) of people counter module. Allowed values are always/never/on-failure/on-unhealthy.
Start the Web UI
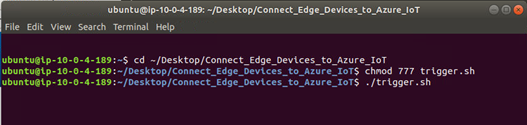
1. Navigate to Connect_Edge_Devices_to_Azure_IoT in the folder on the desktop and run the commands in terminal as shown below:
chmod 777 trigger.sh

./trigger.sh
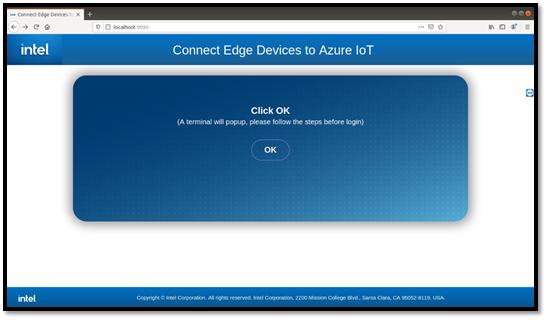
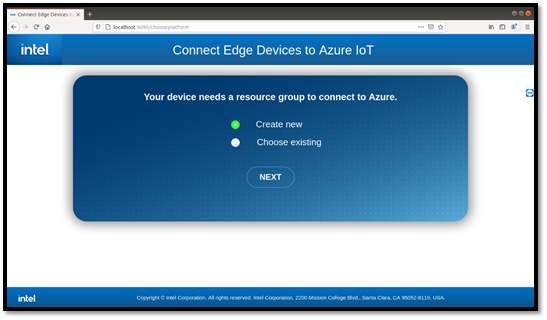
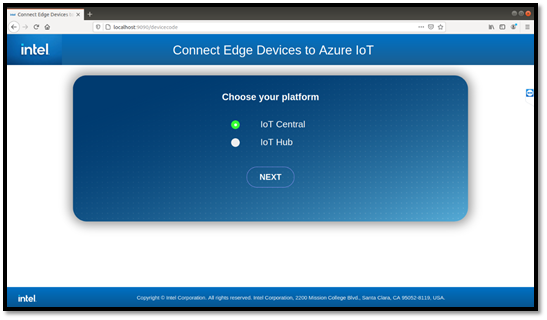
2. The application will start in the default browser and you will see the screen as shown below:
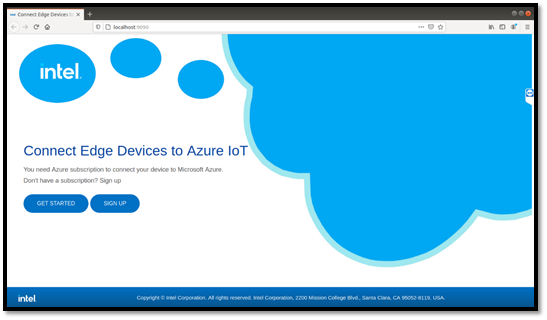
Next, choose your platform:
- Follow Connect to Azure IoT Hub for IoT Hub.
- Follow Connect to Azure IoT Central for IoT Central. This option allows you to monitor and visualize data.
Connect to Azure IoT Hub
1. Choose IoT Hub. Click Next. If the root user has password then, go back to the terminal and enter the root user password.

2. If you want to create a new resource group (RG), select Create new, or select Choose existing to proceed with an existing RG.
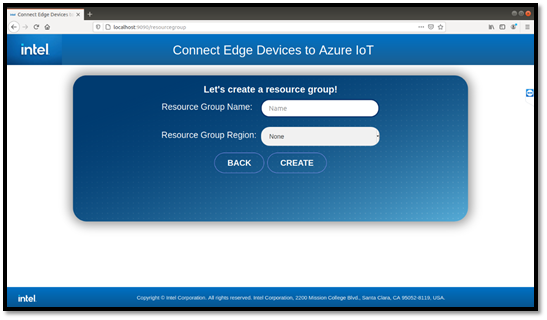
3. To create an RG, enter an RG Name choose a region from the dropdown. Click Create.
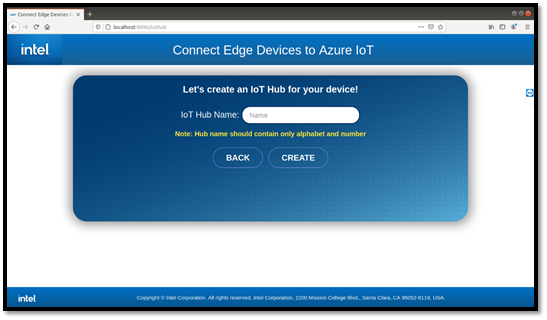
4. Enter an IoT Hub Name. Click Create.
5. Enter an IoT Edge Device Name. Click Create.
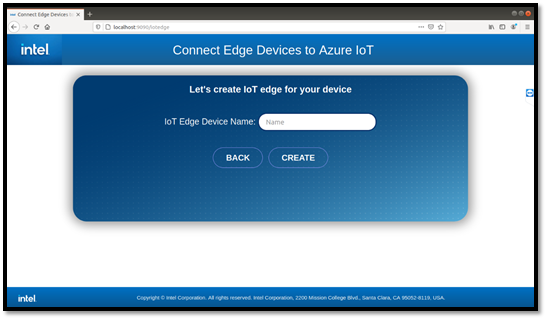
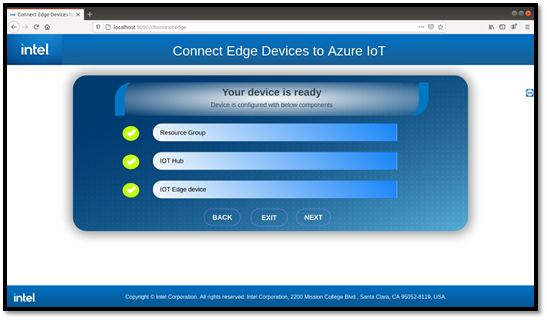
Your hardware is now configured with Resource group, IoT Hub and IoT Edge. A connection has been made between your hardware and Microsoft Azure.
6. Click Exit to exit from the application or Next to proceed further to deploy a module.
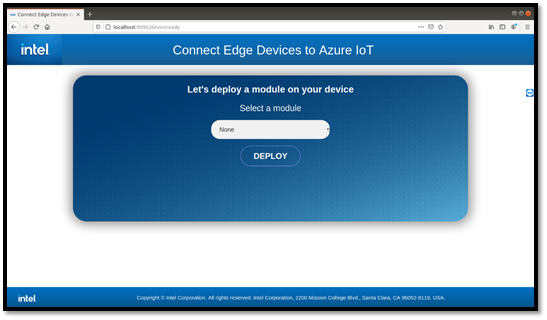
7. Select a module to deploy from the dropdown. Click Deploy.
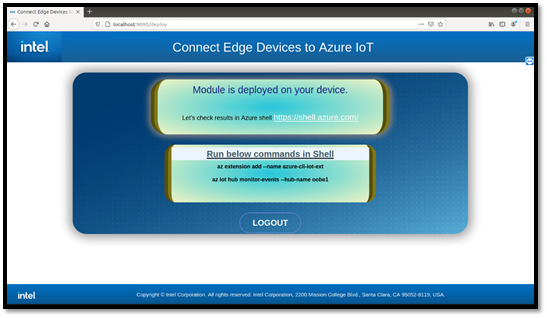
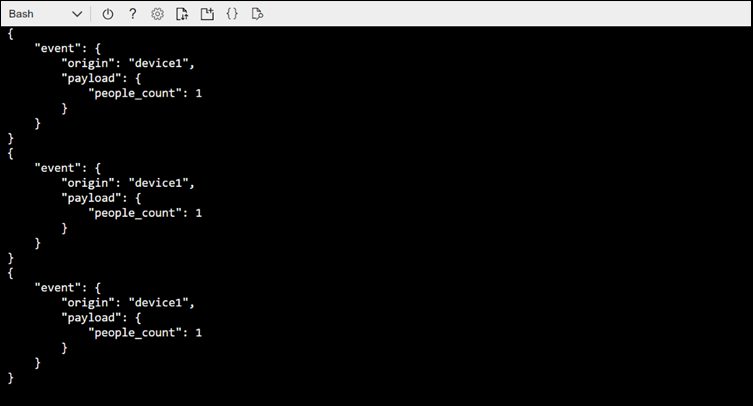
8. Once the module is deployed, follow the steps mentioned in the below screen to see the result in Azure shell.
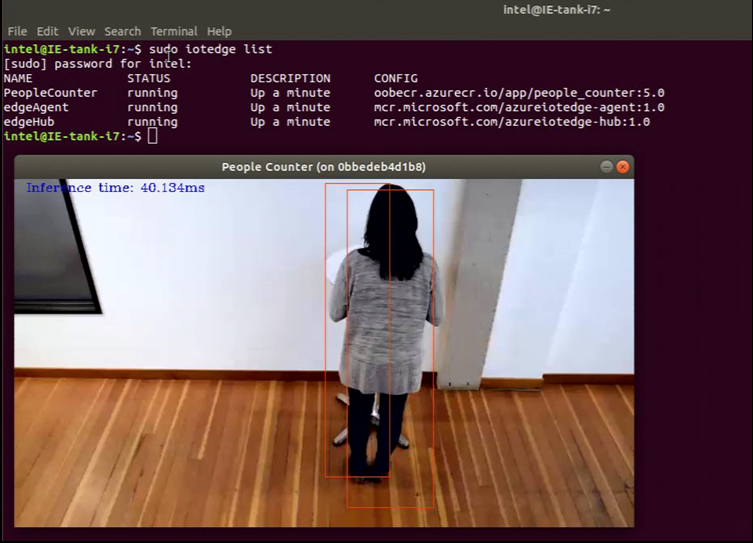
Inference results on Edge device render onto display and you will see a screen like the below:
NOTE: These are for CPU only. Performance is dependent on the generation of CPU. Overall performance will depend on the target hardware you choose. To offload CPU and run inference on iGPU or accelerator card, look for additional instructions. People counter application uses pedestrian-detection-adas-0002 from Intel® Distribution of OpenVINO™ toolkit zoo model for inference.
Results in Azure shell will be like the screen below:
Troubleshooting
People Counter Module Failed
People counter module with status failed after successful deployment.
Try restarting people counter module by running command below:
iotedge restart peopleCounter
If the people counter module is still failing, make sure of the following:
- Video source is working
- Inference device is enabled in the system
Check the logs of container by running command below for details:
lotedge logs peopleCounter
No Results in Azure Shell
After deployment, if the module is in running state and if you are not able to see results in Azure shell.
- Reason: Your network would be blocking to send results to cloud.
- Solution: Connect to a different network and redeploy the module.
Open Network Connection Failure
When you are running the application in open network and after deployment, if you are unable to connect to https://shell.azure.com/.
- Reason: Your account does not have access to login to Microsoft Azure from an open network.
- Solution: Use a different device that is connected to a required network to login to Microsoft Azure.
Connect to Azure IoT Central
This section shows a simple example using the People Counter.
To create an Azure IoT Central, after the Getting Started section above, choose the Azure IoT Central Platform. Click Next. If the root user has a password, go back to the terminal and enter the root password.
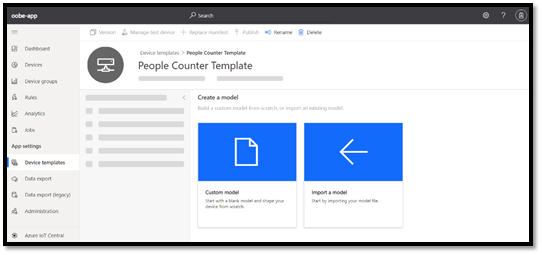
Step 1: Create Device Template
This section will cover how to create a device template for People Counter application. In following steps, you are going to create a device template using provided DCM json file, create view for telemetry, upload deployment manifest and publish the device template.
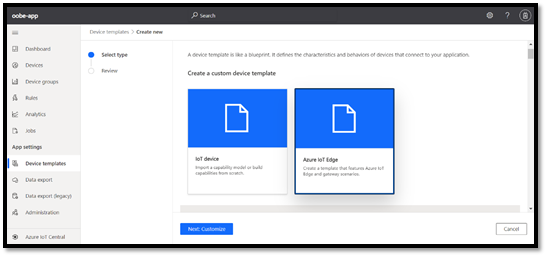
1. Go to IoT central application that you created in Step 1: Create IoT Central Application, then navigate to Device templates and choose +New.
2. On the select template type page, choose the Azure IoT Edge tile. Then select Next:Customize.
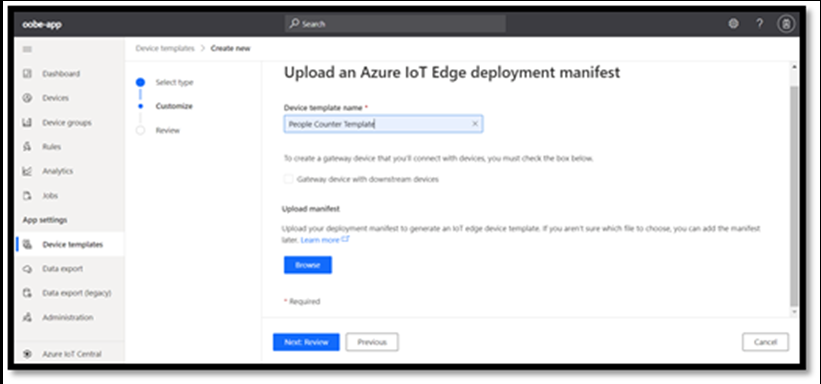
3. On the Upload an Azure IoT Edge deployment manifest page, provide a name to device template and select Next: Review
NOTE:
1. Skip uploading of deployment manifest file in this step
2. No need to select the check box for Gateway device with downstream devices
4. On Review page, select Create.
5. Click on Import a model and upload the capability model People_Counter_DCM.json (Available inside ~/Desktop/Connect_Edge_Devices_to_Azure_IoT/Cloud/Device_Template folder).
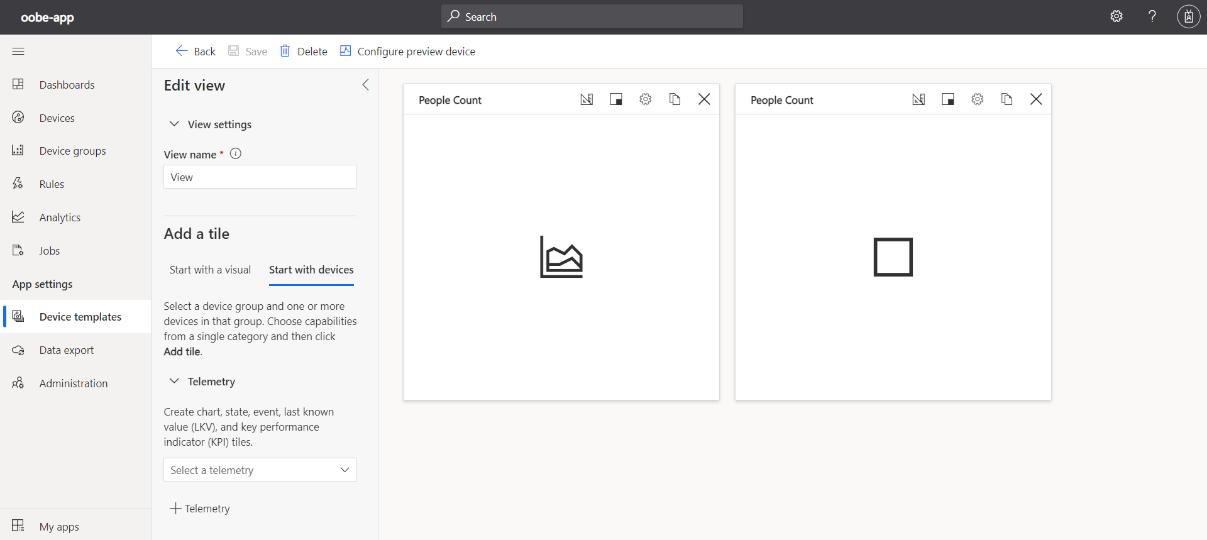
6. To create a view, click on ‘Views’ and choose ‘Visualizing the Device’.
- Under ‘Add a tile’ section, choose ‘Start with device’
- For line graph:
- Choose ‘People Count’ under telemetry section.
- Click on Add tile and Save.
- For Last known value:
- Choose ‘People Count’ under telemetry section.
- Click on Add tile.
- On right panel, click on ‘Change Visualization’ icon and choose ‘Last Known Value’ from options.
- Click on Save button to save the views
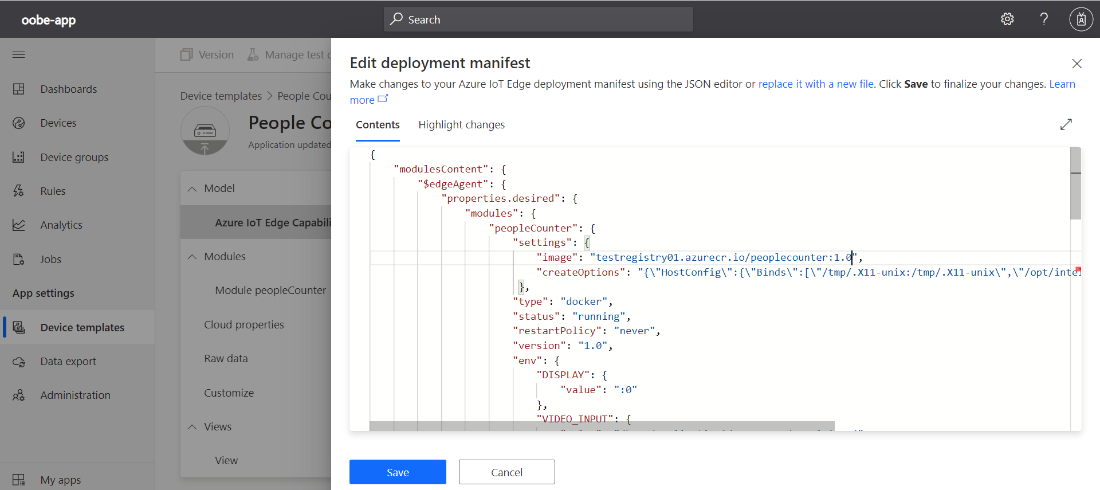
7. Click on ’Edit manifest’ and choose the replace option to upload the deployment.json (Available inside ~/Desktop/Connect_Edge_Devices_to_Azure_IoT/Cloud/Deployment_Manifest folder). Click on Save to save the changes.
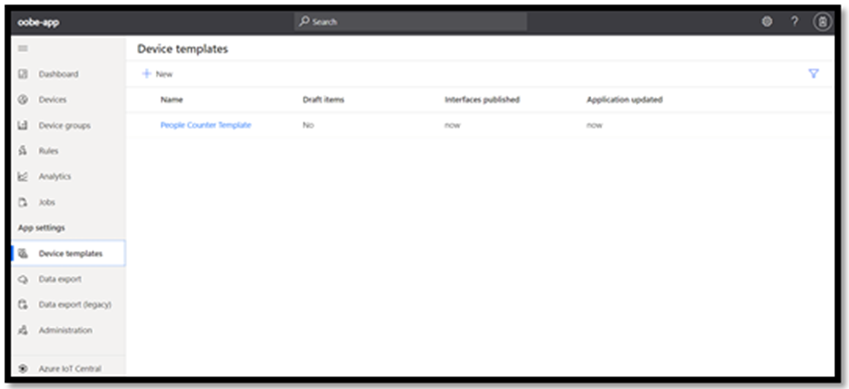
8. Click on ‘publish’ tab on top right corner and click on ‘publish’ button to publish your device template.
Step 2: Add Device to Template
In the next series of steps, you are going to attach an edge device to published people counter device template.To add a new device to your template, follow the steps below:
1. In your IoT Central Application, navigate to Devices page and choose the template you created in the previous step.
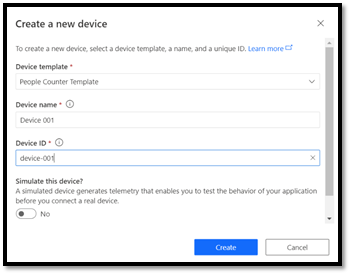
2. Click on ‘+ New’ to add new device to template.
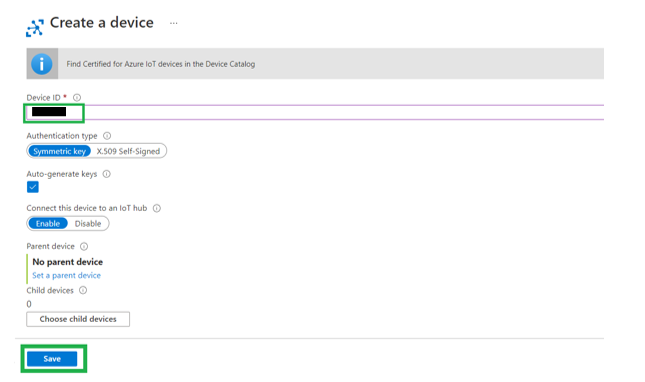
3. Provide the required details and click Create. (Refer to the screenshot below).
- Make sure you choose the right device template from drop-down box.
- Give a display name to your Device.
- Provide a Device ID and make of note of Device ID.
- Do not enable ‘Simulate this device’ option.
Step 3: Generate API Token
In next series of steps, you are going to generate API token. API token is used to fetch device connection parameters. Please make a note of API token.
1. In your IoT Central Application, navigate to Administration page and choose API tokens.
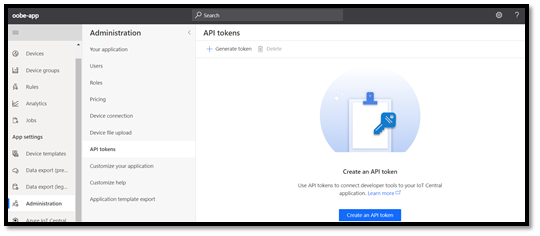
2. Click on ‘+ Generate token’.
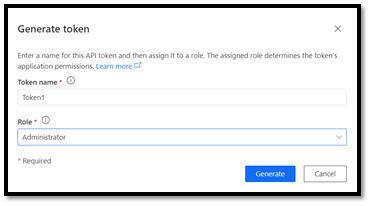
3. Provide the required details and click on Generate.
4. Provide Token name and choose the ‘Administrator’ role.
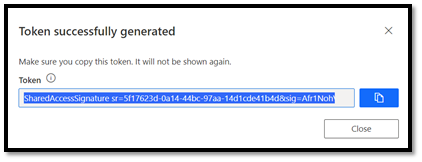
5. API token is generated. Please make sure you copy that token.
Step 4: Get IoT Central APP Sub-Domain Name
In next series of steps, you are going to get subdomain URL of your Azure IoT Central dashboard.
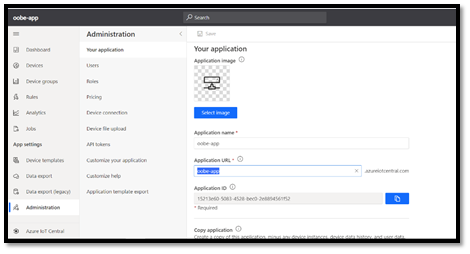
1. In your IoT Central Application, navigate to Administration page and choose Your application.
2. Make a note of subdomain URL (first part of Application URL) to configure OOBE app.
Step 5: Configure Out Of Box Experience (OOBE) Application
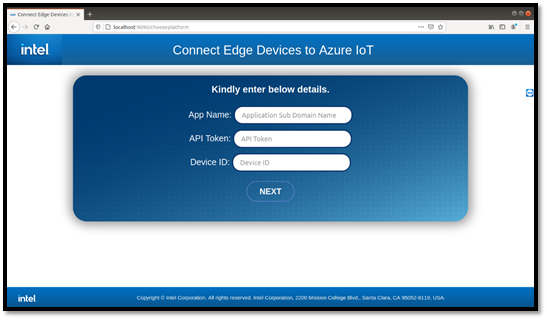
Once you have completed steps above, please provide the details below to OOBE application as shown in the image and click Next. If the root user has a password, then go back to the terminal and enter the root user password.
- App Name: Your IoT Central Application sub-domain name.
- API Token: API token of your IoT Central application.
- Device ID: Device ID of device you attached to device template.
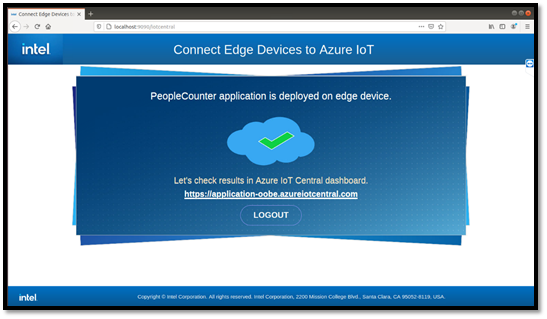
Step 6: Monitor Data
The people counter application is now deployed in edge machine. Once the ‘peopleCounter’ start running as edge module, please go to your IoT Central dashboard (Dashboard link will be available in OOBE web page) and navigate to your Device then click View tab to monitor data.
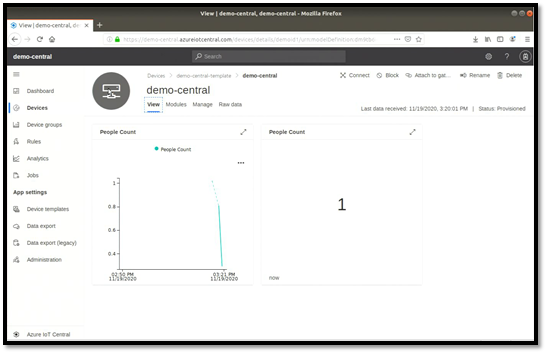
Azure IoT Central Dashboard View
Inference Results on Edge
NOTE: These are for CPU only and performance is dependent on the generation of CPU. Overall performance will depend on the target hardware you choose. To offload CPU and run inference on iGPU or accelerator card, look for additional instructions.
Troubleshooting
People Counter Module Failed
People counter module with status failed after successful deployment.
Try restarting people counter module by running command below:
iotedge restart peopleCounter
If the people counter module is still failing, make sure of the following:
- Video source is working
- Inference device is enabled in the system
Check the logs of container by running command below for details:
lotedge logs peopleCounter
No Results in Azure IoT Central Dashboard
After deployment, if the module is in running state and if you are not able to view results in Azure IoT Central Dashboard.
- Reason: Your network is blocking to send results to cloud.
- Solution: Connect to a different network and redeploy the module.
Intel Out-Of-Band Manageability Application for Azure
Overview
Out-Of-Band (OOB) Manageability allows administrators to remotely perform actions such as power up, power down, system updates and more on network assets or devices.
In this section, you will set up a User Out-Of-Band (UOB) Application from Azure IoT along with Open Active Management Technology Cloud Toolkit (Open AMT Cloud Toolkit) to remotely manage Intel vPro® Platform based edge devices for IoT use cases. This application provides an example on how to extend otherwise Cloud agnostic Open AMT Cloud Toolkit to be paired with existing Azure IoT Solutions to enable OOB to edge devices. You can add OOB Manageability functionality on top of other ESH applications.
There are two components to this setup, a Cloud Server module (UOB App) and an Edge Client module. The Server application is deployed along with other Open AMT Cloud Toolkit Server modules in the Cloud and the Client module is co-located with Open AMT Cloud Toolkit Client Module on the Edge device.
The following terms are important for understanding how the application works:
- Intel® vPro technology is a Platform (brand) that describes a set of hardware features.
- Intel® Active Management Technology or Intel® AMT is a combination of hardware and firmware components available on Intel® vPro Platforms.
- Open AMT Cloud Toolkit is an open source enabling software that allows device management solutions to easily add OOB capabilities to existing solutions. It provides open-source, modular microservices and libraries for the integration of Intel® AMT.
The key components of the example are shown in the following diagram and described in the paragraphs below.
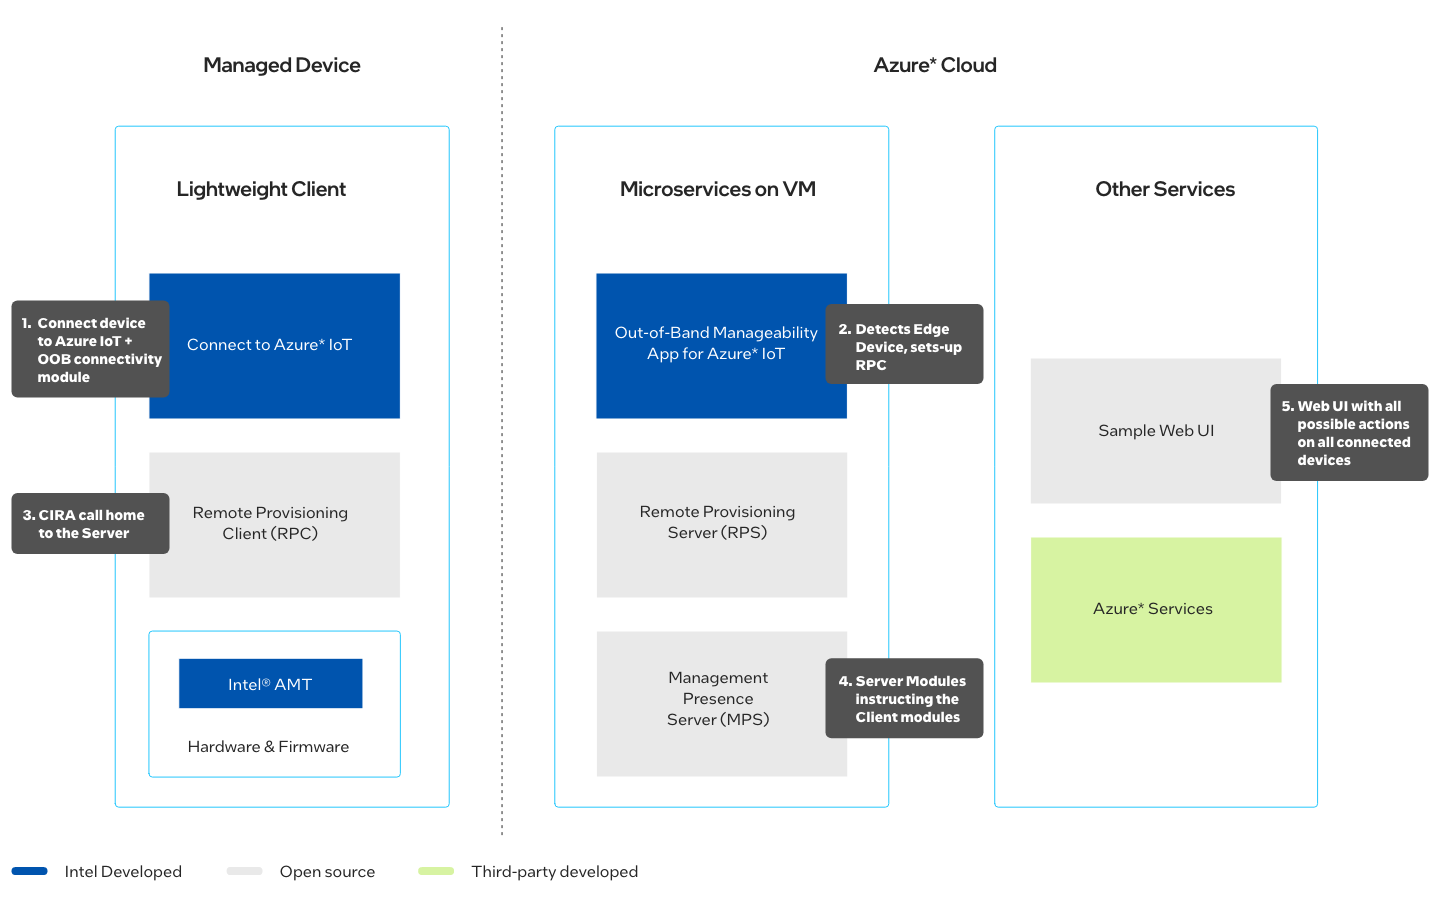
Open AMT Cloud Toolkit
Some of the key capabilities of the toolkit include remote power actions such as Power On, Reset, Power Cycle and Intel® AMT redirection use cases such as Keyboard, Video, Mouse (KVM) control.
Open AMT Cloud Toolkit consists of the following major components:
- Management Presence Server (MPS): Microservice that runs in the Cloud. It maintains connectivity to the Edge Device.
- Remote Provisioning Server (RPS): Microservice that runs in the Cloud. It activates Intel® AMT platforms to the MPS for manageability use cases.
- Remote Provisioning Client (RPC): A lightweight client application that runs on the Edge Device. It communicates with the RPS server to activate Intel® AMT.
- Sample Web UI: A web-based UI that demonstrates use cases of the UI Toolkit and the function and use of the toolkit's microservices.
The User Out-of-Band (User OOB) Management Application is a microservice that runs in the Cloud and acts as the Server module. It acts as a bridge between Azure IoT and services and Open AMT Cloud Toolkit services, MPS, RPS and Web UI. This Cloud component is also called the UOB Application through the rest of this guide.
The Client Module runs on the Edge device and performs two functions. First, it helps the user to connect the edge device to Azure IoT. Second, it performs Client manageability functions as instructed by the UOB Server application.
All communications between the UOB Cloud and the Edge modules are through Azure IoT Hub.
NOTE: All the above components are reference modules. For more information on Open AMT Cloud Toolkit, refer to GitHub documentation.
Target System Requirements
Edge: Intel vPro® Platforms
- Intel® Active Management Technology (Intel® AMT) Version 8.0 or newer
- Docker 20.10.16
- Docker-compose 2.6.0
- Windows 10 or Ubuntu* 18.04
- Supported Configuration – Connect to Azure IoT Hub with IoT Device
Typically, most Intel® Core™ i5 and above devices. It is important to check before you make any purchases.
Secondary Device (Development System / Cloud)
- Ubuntu* 18.04 or newer
- Docker 20.10.16
- Docker-compose 2.6.0
User Out-of-Band (UOB) Application with Azure IoT
The User OOB (UOB) Cloud and Edge Modules are not part of the standard Open AMT Toolkit and are developed as user companion application to Azure IoT. This section provides details on how to deploy these modules along with Open AMT Cloud Toolkit modules for Azure IoT.
The UOB application uses Intel® AMT through RPC on the edge device, RPS, MPS, Sample Web UI features in conjunction with Azure IoT Services like Event Handler, Device Management SDK and SQLite* database on the Cloud. This application acts as server and the IoT edge device acts as remote device which will be monitored and managed by the UOB Application.
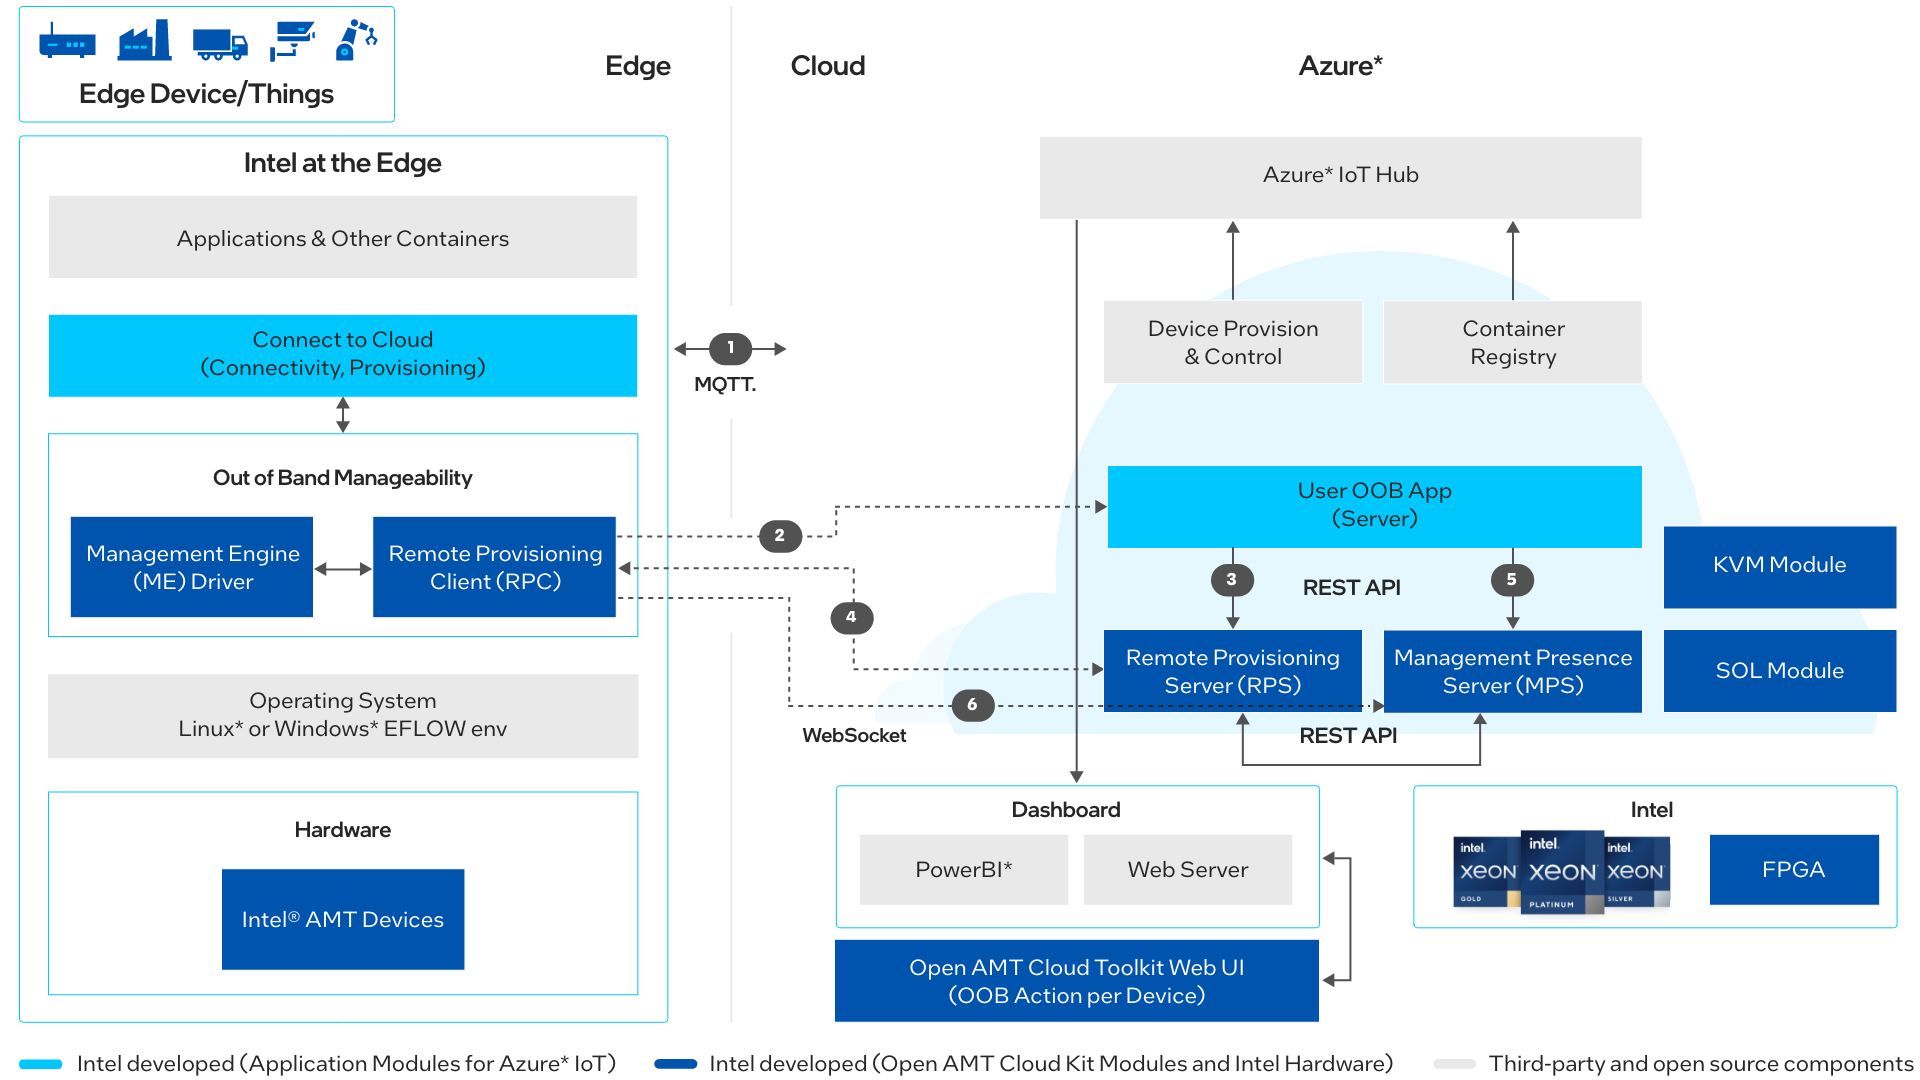
The following steps provide an overview of the end-to-end flow:
- UOB Server Application subscribes to Event handler to listen to events on the IoT Hub. Each time a new device is connected to IoT Hub, it creates and entry and tracks the state of the device.
The Connect to Cloud Client module on the edge device not only serves to enable IoT Hub connectivity but also responds as a client to requests from server module. - UOB Application initiates device check after the device is connected to the IoT Hub to determine if the underlying hardware includes Intel vPro® technology.
UOB listens to device response and records if it is Intel® vPro device or non vPro device.
UOB takes follow-on actions to update the database, trigger the event for the event hub, send the data to the event hub, and update the Device dashboard. - UOB informs RPS of the OOB devices it can manage.
- RPS then activates and configures Intel® AMT on the device. RPC then establishes CIRA connection to Management Presence Server (MPS).
- The user can initiate actions to be performed on the device, such as power-up/reset etc., if the device is disconnected through Web UI.
- MPS performs OOB actions, through MPS REST APIs, to complete the user instructed actions on the Intel® AMT device.
NOTE: Even though both Intel vPro® devices and other types of devices are displayed on the device dashboard, OOB actions can only be performed on Intel vPro® Platforms.
To summarize, the UOB application will be deployed in Azure Cloud Virtual Machine (VM) along with MPS, RPS, Sample Web UI from Open AMT Toolkit and the Client module will be deployed onto Intel vPro® based IoT device. When an IoT device experiences an unplanned downtime, the IT Administrator can remotely manage that device using the UOB application from the Azure Cloud.
You can use the UOB application with any of the reference implementations in the Additional Examples section of this guide.
Azure Prerequisites
- Azure subscription.
If your subscription is not registered for the following Resource providers, please follow the below steps to register.- Choose your subscription in the portal, select Resource providers within your subscription dashboard.
- Click the Register link to register the resource provider of the type you are trying to deploy from the list of resource providers.
- Create an Azure IoT Hub.
If you have a preexisting Azure IoT Hub, you can use it and set up the rest of the steps.

-
Add Device to IoT Hub, make a note of the primary connection string.
-
Create Event Hub Namespace under the same resource group where IoT Hub is created.
-
Create an Event Hub under the same name space. Select Shared access policies under Event Hub instance and add SAS policy by providing policy name and select manage, send, and listen options.
-
Create an Event/Event Grid System Topic Subscription under IoT Hub - Events with below options.
Name > Any name of your choice
Event Schema > Select Event Grid schema, event types
Event Types > Select device connected, device disconnected
For Endpoint > Select Event Hub -
Create a second Event Hub within the same namespace that was created before and follow step 5.
-
Create an Event Grid Topic for custom event.
Add Event Subscription to the Event grid topic that was just created, provide name, and select second Event Hub as Endpoint. -
Create a Power BI account and then Create Azure Stream Analytics Job. Keep the Job within the same resource group where the Azure IoT Hub was created.
-
To add input: Open the Stream Analytics Job, under Job topology, select Input, choose Add stream input and then select Event Hub from the drop-down list. On the new input pane, enter the following information:
Input alias: Enter a unique alias
Select Event Hub from your subscription and give your Azure subscription.
Event Hub Namespace and Event Hub: Select these you have created for Event Grid custom event.
Event Hub consumer group: Choose use existing and select the $Default consumer group.
Authentication mode: Select Connection string from the drop-down.
Event Hub policy name: Choose use existing and select the Shared Access Policy you created in the above section.
Leave all other fields as default and save it. -
To add Power BI output: Open the Stream Analytics Job, under Job topology, select Output, choose Add, and then select Power BI from the drop-down list. On the Power BI - New output pane, select Authorize and sign into Power BI account.
-
After you signed into Power BI, enter the following information:
Output alias: A unique alias
Group workspace: Select your target group workspace.
Dataset name: Enter a dataset name
Table name: Enter a table name
Authentication mode: Leave at the default and save it. -
Configure the query of the Stream Analytics Job by replacing it with the input and output alias of the job:
SELECT data.hostname ,data.isvPro, data.guid, data.amtmode, data.PowerState, data.ActionState, eventType as status, eventTime
INTO
     [YourOutputAlias]
FROM
     [YourInputAlias]
WHERE eventType IN ('Connected','Disconnected')
-
To run the Stream Analytics Job, select Overview and choose Start > Now > Start.
Once the job starts successfully, the job status changes from Stopped to Running.
Refer to the Azure links in the Learn More section for additional information.
Deploy Server Module on the Cloud VM
This section will walk you through the process of deploying Open AMT Cloud Toolkit containers, UOB application on an Azure Virtual Machine (VM). Let’s start with creating an Azure Linux VM which will act as server machine. Follow the Create a virtual machine instructions to create a Linux VM and keep the VM within the same resource group where the IoT Hub has been created.
NOTE: Advanced users can refer to Azure documentation on Create multi-container groups to create and deploy multi-container groups to handle all the cloud containers instead of single steps as explained below.
Deploy Open AMT Cloud Toolkit Microservices
For experienced users, to quickly deploy Open AMT Cloud Toolkit on Azure, follow the steps below until step 7, or new users can skip to step 8 for a deployment on a local system.
-
Create an Azure container registry (ACR).
- Go to Azure portal > container registry > choose your container registry > Access Keys.
Enable Admin user and get the details of Container registry and make a note of username, password, and login server for further steps. - Login to your Azure container registry:
sudo docker login -u <ACR username> -p <ACR password> <ACR login server> - Pull the Open AMT Cloud Toolkit Docker images from the Intel Docker Hub repository.
sudo docker pull intel/oact-mps:latest
sudo docker pull intel/oact-rps:latest
sudo docker pull intel/oact-webui:latest
- Tag the Open AMT Cloud Toolkit docker images.
sudo docker tag intel/oact-mps:latest <ACR login server>/oact-mps:latest sudo docker tag intel/oact-rps:latest <ACR login server>/oact-rps:latest sudo docker tag intel/oact-webui:latest <ACR login server>/oact-webui:latest -
Push the Open AMT Cloud Toolkit docker images to ACR.
sudo docker push <ACR login server>/oact-mps:latest sudo docker push <ACR login server>/oact-rps:latest sudo docker push <ACR login server>/oact-webui:latest -
Next, deploy the stack on Azure using the Deploy to Azure button from Open AMT Cloud Toolkit GitHub link.
NOTE: This requires ACR login server (Registry), Registry username, and password details. Also update the MPS, RPS, and Sample Web UI image names from the ACR.
Once the deployment is done, go to Azure portal > container instances > choose your container instances and get the FQDN for the further steps.
Under container instance, Go to Settings > Containers > MPS > properties and get the details of MPS_COMMON_NAME, MPS_WEB_ADMIN_USER, MPS_WEB_ADMIN_PASSWORD for further steps.
Follow the Open AMT Cloud Toolkit configuration guide and complete the setup until you reach the section where you will be creating Client Control Mode (CCM) profile.
NOTE: Refer to the below command while logging into Sample Web UI and choose FQDN while creating CIRA configuration.https://<Open AMT Cloud Toolkit-container-instance-fqdn>:8443/If Open AMT Cloud Toolkit is deployed on Azure stack, need to use port 8443.
-
Optionally, deploy Open AMT Cloud Toolkit microservices on a local development system as Docker* containers by following the Open AMT Cloud Toolkit Get Started instructions. Complete the setup until you reach the section where you will be creating Client Control Mode (CCM) profile.
NOTE: If any of the Open AMT containers are not running or docker-compose pull command is not working while doing step 8, use the below commands to build the containers instead of pulling the Docker images from Intel's Docker Hub repository.cd open-amt-cloud-toolkit sudo docker-compose build
Deploy UOB Application on Azure VM
Follow the below steps to deploy the UOB Application.
- Pull the UOB Application Image from the Azure Marketplace or from the Docker Hub and deploy it on Azure VM. Choose one of the following options:
- Option 1: Azure Marketplace: Click Get It Now and choose the "User App for Out-of-Band Manageability with Azure IoT" option under Software plan to pull the image. Follow the instructions to subscribe User OOB Module for Azure IoT. Deploy it on Azure VM by entering the following commands:
sudo docker login -u <ACR username> -p <ACR password> <ACR login server> sudo docker pull <ACR login server>/intel_corporation/uobappserver:latest - Option 2: Docker Hub: Pull the image from the Intel Docker Hub repository:
sudo docker pull intel/user-oob-server-app-for-azure:latest
- Option 1: Azure Marketplace: Click Get It Now and choose the "User App for Out-of-Band Manageability with Azure IoT" option under Software plan to pull the image. Follow the instructions to subscribe User OOB Module for Azure IoT. Deploy it on Azure VM by entering the following commands:
-
Create the .env file, uob_setup.sh and docker-compose.yaml in Desktop of the VM and set up the environment variables. Update the yaml file before running the UOB Application in the .env file.
Refer to the following .env template in order to configure the environment variables required by the server module.HOST_IP=azure_server_vm_ipaddress MPS_SERVER_ADDRESS=container_instance_fqdn:8443 or development_IP_address MPS_WEB_ADMIN_USER=mps_username MPS_WEB_ADMIN_PASSWORD=mps_password AMT_MODE_PROFILE_NAME=amt_mode_profile_name EVENTHUB_CONNECTION_STRING=event_hub_connection_string EVENTHUB_NAME=event_hub_name IOTHUB_SERVICE_CONNECTION_STRING=hub_service_connection_string CUSTOM_TOPIC_EVENTGRID_KEY=custom_topic_eventgrid_key CUSTOM_TOPIC_EVENTGRID_ENDPOINT=custom_topic_eventgrid_endpoint ENABLE_AUTOMATIC_POWER_ACTION=True/False ENABLE_SSL=no ## Required only if SSL is enabled SSL_CERT_PATH=<Path_to_SSL_certificate>
NOTE: If you enable SSL, deploy own certificates (typically signed by a CA) and configure the Kong (API Gateway) with CA signed certs. Refer to Learn More for advanced features.
- Follow the instructions below to set up and replace the environment variable values inside the .env file.
| ENVIRONMENT VARIABLE NAME |
VALUE |
DESCRIPTION |
|---|---|---|
| HOST IP |
<azure_server_vm_ipaddress> |
Provide the Azure VM IP Address. |
| MPS_SERVER_ADDRESS |
<azure_container_instance_fqdn:8443 |
Fetch the details from azure container |
| EVENTHUB_CONNECTION_STRING |
<event_hub_connection_string> |
Navigate to event hub namespace |
| IOTHUB_SERVICE_CONNECTION_STRING |
<hub_service_connection_string> |
Navigate to the hub portal and click on |
| CUSTOM_TOPIC_EVENTGRID_KEY |
<custom_topic_eventgrid_key> |
Navigate to the Event Grid Topic |
| ENABLE_AUTOMATIC_POWER_ACTION |
<True/False> |
To enable automatic mode, set the |
| ENABLE_SSL |
no |
Set the value to “yes”/”no”. |
| SSL_CERT_PATH |
<Path_to_SSL_certificate> |
Required only if SSL is enabled. |
- Create a docker-compose.yaml file to configure the services and to start the services by spinning up the container by following the below steps:
version: "3.9" services: uob-server: image: <update uob-server image url> user: "30000:30000" environment: - MPS_SERVER_ADDRESS=$MPS_SERVER_ADDRESS - MPS_WEB_ADMIN_USER=$MPS_WEB_ADMIN_USER - MPS_WEB_ADMIN_PASSWORD=$MPS_WEB_ADMIN_PASSWORD - EVENTHUB_CONNECTION_STRING=$EVENTHUB_CONNECTION_STRING - EVENTHUB_NAME=$EVENTHUB_NAME - IOTHUB_SERVICE_CONNECTION_STRING=$IOTHUB_SERVICE_CONNECTION_STRING - AMT_MODE_PROFILE_NAME=$AMT_MODE_PROFILE_NAME - CUSTOM_TOPIC_EVENTGRID_KEY=$CUSTOM_TOPIC_EVENTGRID_KEY - CUSTOM_TOPIC_EVENTGRID_ENDPOINT=$CUSTOM_TOPIC_EVENTGRID_ENDPOINT - ENABLE_AUTOMATIC_POWER_ACTION=$ENABLE_AUTOMATIC_POWER_ACTION - ENABLE_SSL=$ENABLE_SSL - SSL_CERT_PATH=$SSL_CERT_PATH read_only: true container_name: uob-server volumes: - /opt/manageability:/opt/manageability security_opt: - no-new-privileges - apparmor:docker-default cap_drop: - ALL - Create a uob_setup.sh script to create a directory to store the the SQLite database that contains the device information by following the below steps:
mkdir /opt/manageability/ groupadd -g 30000 manageability useradd -u 30000 manageability_user usermod -g manageability manageability_user chown -R manageability_user:manageability /opt/manageability/ - Run the uob_setup.sh script with the following commands:
chmod +x uob_setup.sh
sudo bash uob_setup.sh
Deploy Client Module on the Edge Device
At this stage, UOB application deployment is done on Azure Linux VM which will act as a server for the edge devices.
The purpose of the client module is to connect the edge device to Azure IoT and perform client manageability functions as instructed by the Out-of-Band Server application.
To set up the edge device, install the client module and enable the manageability feature.
Deployment on Linux
Follow one of the approaches below to set up the edge device:
-
Method 1: Deploy the UOB Client Container. For quick deployment, use this approach and deploy the client module as a container for custom solutions, to enable the manageability feature.
NOTE: This approach is applicable for Linux only. -
Method 2: Deploy in native environment using the Connect Edge Devices to Azure IoT module. If you have integrated with existing RIs or any other custom solutions in native environment, use this approach to enable the manageability feature.
Method 1: Deploy the UOB Client Container
- Pull the UOB Client Image from the Azure Marketplace or from Docker hub and deploy it on the edge device.
Choose one of the following options:- Azure Marketplace: Click Get It Now and choose the "Client Module for User App for Out-of-Band Manageability with Azure IoT" option under Software plan to pull the image. Follow the instructions to deploy it on edge by entering the following commands:
sudo docker login -u <ACR username> -p <ACR password> <ACR login server> sudo docker pull <ACR login server>/intel_corporation/uob-client:latest - Docker Hub: Pull the image from Intel Docker Hub repository with the command:
sudo docker pull intel/user-oob-client-for-azure
- Azure Marketplace: Click Get It Now and choose the "Client Module for User App for Out-of-Band Manageability with Azure IoT" option under Software plan to pull the image. Follow the instructions to deploy it on edge by entering the following commands:
-
Create the .env file, start_edge_uob_client.sh and docker-compose.yaml in Desktop of the VM and set up the environment variables. Update the yaml file before running the UOB Client.
Refer to the following .env template in order to configure the environment variables required by the client module.IOTHUB_DEVICE_CONNECTION_STRING=hub_device_connection_string
NOTE: For the IoT Hub variable value, navigate to the IoT Hub portal that was created earlier and click on Device Management - Devices, select the device and use the primary device connection string. If you have already connected to the IoT Hub, use another logical IoT Device and its connection string. -
Create a docker-compose.yaml file to configure the services and to start the services by spinning up the container by following the below steps:
version: "3.9" services: uob-client: image: <update uob-client image url> environment: - IOTHUB_DEVICE_CONNECTION_STRING=$IOTHUB_DEVICE_CONNECTION_STRING read_only: true container_name: uob-client network_mode: "host" devices: - /dev/mei0:/dev/mei0 security_opt: - no-new-privileges - apparmor:docker-default cap_drop: - ALL deploy: resources: reservations: #cpus: '0.5' memory: 1G #limits: # cpus: '4' # memory: 3G -
Create a start_edge_uob_client.sh script to check the existence of Intel Management Engine Interface (Intel MEI) Linux driver and to spin up the Docker container with docker-compose up command by following the below steps:
#!/bin/sh
#check and executes if mei0 driver exists
if [ -e "/dev/mei0" ]; then
  sudo docker-compose up
#executes if mei0 driver doesn't exists
else
  sed -i.bak '/devices/,$d' docker-compose.yaml
  sudo docker-compose up
fi
exec "$@"
Method 2: Install the Connect Edge Devices to Azure IoT Module
To set up the edge device, install the Connect Edge Devices to Azure IoT module by following the Get Started instructions in this guide through step 5.
After successful installation, UOB connector will be available inside the connect module directory on the Desktop.
The UOB connector acts as a client and performs client manageability functions as instructed by the UOB Server application and activates the device with Intel® AMT.
Integrate UOB Connector and do the setup to enable the manageability feature by using one of two methods:
-
Using a Reference Implementation (RI) from Connect module:
Deploy any RI following the instructions in the Additional Examples using Azure IoT section in this guide. Complete the setup until you reach the section Deployment in Linux Environment.
NOTE: We have already integrated uob_connector with existing RIs to enable manageability actions on the edge devices.
- Any other custom solutions:
NOTE: You can also enable the manageability feature without any RIs.
Go to the Manageability directory and do the setup using the below commands in a terminal in admin mode.
sudo -s
apt-get -y install python3-pip
pip3 install azure-iot-device==2.9.0
Deployment on Window EFLOW Environment
Follow the instructions in the Additional Examples using Azure IoT section in this guide to set up the edge device in a Windows EFLOW environment.
Once the Application deployment is done, the UOB connector module is used to perform client manageability functions as instructed by the UOB Server application and activate the device with Intel® AMT.
Note that this flow is different from the Linux setup due to container deployment constraints in Windows environment. The steps that are automated in the Linux flow are manual in the Windows flow.
Follow the steps below to do the Manageability Setup on the Windows environment of the EFLOW device:
- Copy UOB Connector windows script from the development machine to the Desktop directory of the Windows OS of EFLOW device.
- For RPC setup, install the following software on your system:
- Go* Programming Language
- tdm-gcc (On Windows* only)
-
Build and generate the RPC executable by following the instructions from Open AMT Cloud Toolkit guide until you reach the build RPC section.
-
After building the RPC, copy the executable to the Desktop directory of the device.
NOTE: Put it in the same directory as the UOB connector file. - Install Python and navigate to the directory containing the RPC application, open a Command Prompt as Administrator, and run the following command:
pip install azure-iot-device==2.9.0
Perform Out-Of-Band Management
The UOB Application listens and triggers alerts to Open AMT Cloud Toolkit manageability engines for any corrective manageability actions.
In an earlier section of this guide, the UOB application was deployed but not started. To monitor the edge devices, first we need to start the UOB application and when the edge device goes down, we will perform the OOB management to make the device up and running from Azure Cloud without visiting the edge device place in person.
To start the UOB Application, follow the steps below:
-
If Open AMT Cloud Toolkit microservices are deployed on a local system as Docker containers, follow the below steps.
Otherwise, skip these steps if the Open AMT Cloud Toolkit is deployed on an Azure container instance.-
Add the IP address of Azure Server VM in Azure Server VM Network Security group.
-
Add the IP address of Intel® AMT Edge devices in the Azure Server VM Network Security group.
-
-
Execute the below command on Azure VM that is created to start the UOB App.
sudo docker-compose upYou will see output in the Azure VM terminal indicating that the application is connecting to Open AMT and it has received tokens.
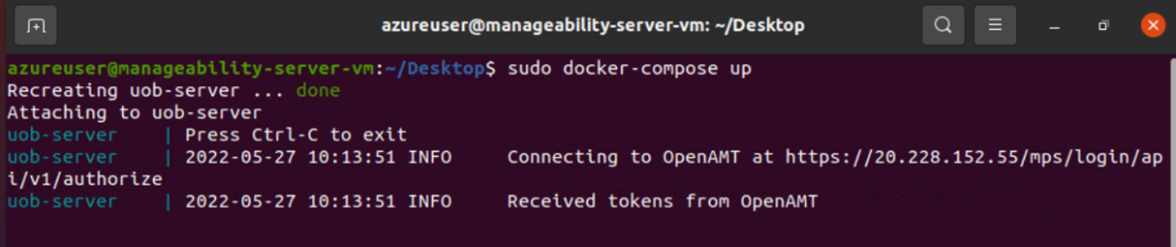
NOTE: The MPS, RPS and Web UI microservices were deployed as containers as part of the setup and are now up and healthy.
-
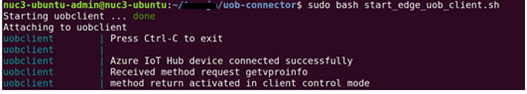
Linux-only step: To enable manageability feature with UOB Client Container, execute the below commands on the edge device or skip to step 4.
sudo -s
chmod +x start_edge_uob_client.sh
sudo bash start_edge_uob_client.sh
You will see output similar to the image below in the edge device terminal.
NOTE: If you have to reset the environment variables, stop the container, and rerun it. To stop the UOB Client, execute the below command:sudo docker-compose down
- Linux-only step: To enable manageability features with any reference implementation from connect module, run the application on the edge device or skip to step 5.
For example, you can run the below command in a terminal to enable manageability feature with Automated Checkout Reference Implementation.sudo bash connect.sh -a “IOT_Hub” -c <IoT Hub connection String> -p <HOST_IP> -I <Interval> -m true
NOTE: The -m option enables the manageability features.
You may expect output like below in the edge device terminal with RI integration.
- Linux-only step: If you want to enable the management feature for your custom solutions, follow the below instructions.
NOTE: You can also enable the manageability feature without any RIs.
Go to the Manageability directory and run the standalone UOB connector using the below commands in a terminal in admin mode.
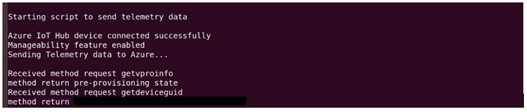
The start_uob_connector* module is a client module run on the edge device and it communicates with the User OOB application on Azure.sudo -s cd ~/Desktop/Connect_Edge_Devices_to_Azure_IoT/Manageability/ export IOTHUB_DEVICE_CONNECTION_STRING=”<conn-string>” python3 start_uob_connector_linux.py
NOTE: For the IoT Hub variable value, navigate to the IoT Hub portal that was created earlier and click on Device Management - Devices, select the device and use the primary device connection string. If you have already connected to the IoT Hub, use another logical IoT Device and its connection string.You will see output similar to the image below in the edge device terminal.

-
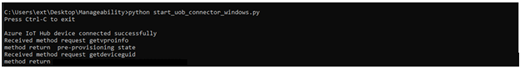
Windows-only step: To enable the manageability feature, open a Command Prompt as Administrator and run the following command.
set IOTHUB_DEVICE_CONNECTION_STRING=conn-string
python start_uob_connector_windows.py
For the IoT Hub variable value, navigate to the IoT Hub portal that was created earlier and click on Device Management - Devices, select the device and use the primary device connection string.You will see output similar to the image below in the edge device terminal.
-
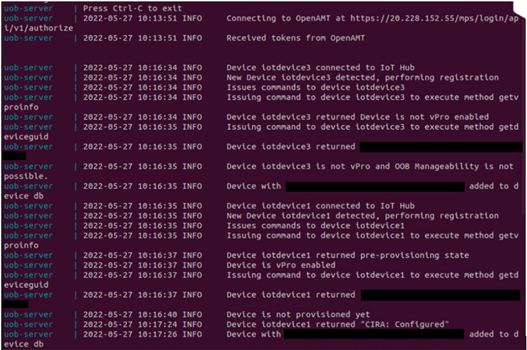
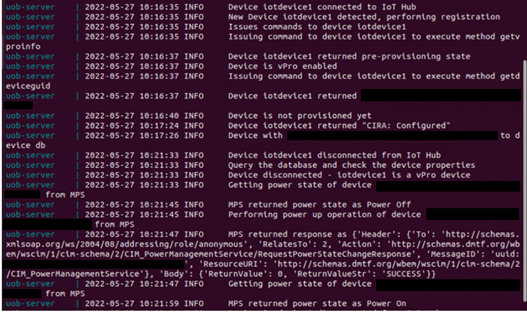
After running the edge client application, you will see output similar to the following in the Azure VM (Server) terminal to see device getting connected.
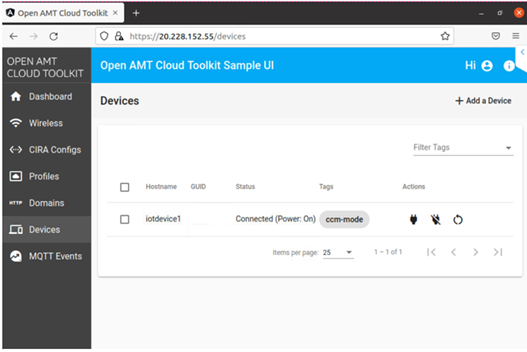
You can also see if the device is connected from a sample Open AMT Cloud Toolkit Web UI as below.
Based on Open AMT Cloud Toolkit Deployment, open any modern web browser and navigate to the following link.
https://Open AMT Cloud Toolkit_container_instance_fqdn:8443/
or
https://Development-IP-Address/
For example, the screenshot below shows a sample Web UI Page:
NOTE: If Intel® AMT edge device is in disconnected state after the successful CIRA configuration, try the below possible solutions.
Workarounds include a) Reboot device and b) Unplug and re-plug network cable.
NOTE: If you have reset the environment variables, stop the container, and rerun it.
To stop the UOB application, execute the command:sudo docker-compose down
NOTE: If you reset the Open AMT environment variables on the UOB App server, unprovision the edge device to reset the environment completely. Run the following command on the edge device to deactivate:
For Linux, run:sudo docker run --net host --device=/dev/mei0 intel/oact-rpc-go:latest deactivate -u wss://<hostipaddr or container_instance_fqdn:8443>/activate -n --password <ccmprofilepassword>
For Windows, run:rpc deactivate -n -u wss://<hostipaddr or container_instance_fqdn:8443>/activate --password <ccmprofilepassword>
Simulate Edge Device Down Scenario
Shut down the edge device manually and see the UOB application logs as well as Open AMT Cloud Toolkit Web UI. Device status can be found as disconnected.
Perform OOB Management by invoking MPS REST API Calls
The edge device went offline, and the device disconnected event got triggered. Now UOB Application performs the power state /power up actions, or you can execute all the manageability actions like power up, power cycle etc., from the Open AMT Cloud Toolkit Sample Web UI.
NOTE: OOB Management is possible only for Intel vPro® enabled edge devices. Use the Open AMT Cloud Toolkit Sample Web UI to perform all the OOB actions like reset, power cycle, sleep etc.
If you have many devices to monitor, control and visualize on a single dashboard view, go to the next section of visualization in Azure Power BI.
Visualization in Microsoft* Power BI*
Power BI is a collection of software services, apps, and connectors that work together to turn unrelated sources of data into coherent, visually immersive, and interactive insights. In the Power BI service, dashboards and reports connect to datasets that brings all the relevant data together in one place.
Run Visualization
In this section, we use Power BI service to view dashboards and reports and to create visuals based on the existing data model. Perform the OOB Actions on the Intel vPro® enabled edge devices by navigating to Open AMT Cloud Toolkit Sample Web UI if the device goes down/disconnects from the IoT Hub.
- Make sure the UOB application server and edge client applications are running.
- Sign in to your Power BI account and select Power BI service from the top menu.
- Select the workspace you used from the side menu, My Workspace.
- Under the All tab or the Datasets + dataflows tab, you should see the datasets that you specified when you created the outputs for the Stream Analytics job.
NOTE: Due to performing sanity checks, please expect delay in event hub custom event data in Power BI. - In My workspace, go to the Event Hub custom topic dataset you created, select More options menu (the three dots to the right of the dataset name), and then select Create report.
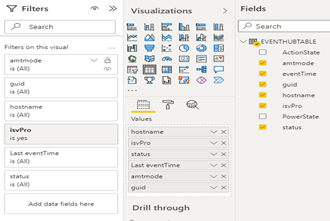
- Create a Table chart to show event hub data for vPro devices.
- On the Visualizations pane of the report creation page, select the Table icon to add a Table chart. Use the guides located on the sides and corners of the chart to adjust its size and position.
- On the Fields pane, expand the table that you specified when you created the output for the Stream Analytics job.
- Drag hostname, isvPro, status, eventTime, amtmode, guid to Values.
- For eventTime, click the dropdown button and select Last filter.
- In the Visualizations pane, click the Format button (looks like a paint roller).
- Go down and find Totals and under Totals, switch to off.
- For isvpro, select yes in filter type under Filters on this visual.
- Under table chart, click on more options and select sort by > LasteventTime. Should be in descending order.
- A table chart is created for Intel vPro® devices.
- Select Save to save the report and click on the pin visual (pin to dashboard) icon, select the dashboard that was created, and select Pin.
- Go to the dashboard and hover over the report you pinned and select More options menu from the report visual (the three dots to the right of the report).
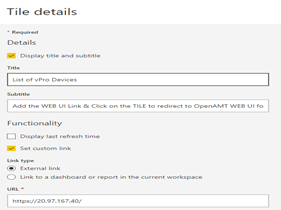
Provide the title and subtitle and select the Display title and subtitle.
Select the Set custom link, LinkType - External Link and provide the Open AMT Web UI Link:
https://Open AMT Cloud Toolkit_Container_Instance_FQDN:8443/ or https://Development-IP-Address/
Select Apply.
- Hover over the Event Hub custom topic dataset you created, select More options menu (the three dots to the right of the dataset name), and then select Create report.
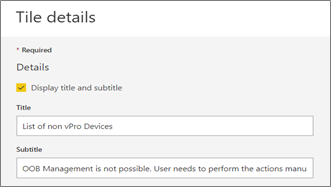
- Follow the same steps to create a Table chart to show event hub data for non vPro devices but select no filter type for isvPro under Filters on this visual.
- A table chart is created for devices that are not based on Intel vPro® technology.
- Select Save to save the report, click on the pin visual (pin to dashboard) icon,select the dashboard that was created, and select Pin.
- Go to the dashboard and hover over the report you pinned and select More options menu from the report visual (the three dots to the right of the report)
Provide the title and subtitle and select the Display title and subtitle and select Apply.
Device Logs
For Intel vPro® Devices with ActionState and PowerState:
- Hover over the Event Hub custom topic dataset you created, select More options menu and then select Create report.
- Follow the same steps in Create a Table chart to show event hub data for Intel vPro® devices but in addition to the existing fields, drag ActionState, PowerState to Values.
- A table chart is created for Intel vPro® device logs with ActionState and PowerState.
- Select Save to save the report, click on the pin visual (pin to dashboard) icon, select the dashboard that was created, and select Pin.
- Go to the dashboard and hover over the report you pinned and select More options menu from the report visual (the three dots to the right of the report).
Provide the title and subtitle and select the Display title and subtitle and select Apply.
For Intel vPro® Device Logs:
- Hover over the Event Hub custom topic dataset you created, select More options menu and then select Create report.
- Follow the steps to Create a Table chart to show event hub data for Intel vPro® devices with ActionState and PowerState.
NOTE: Drag the fields to values and create a table chart but don’t select a filter for eventTime.- A table chart is created for Intel vPro® device logs.
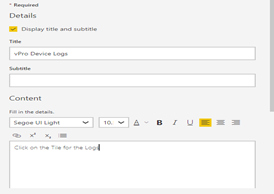
- Navigate to the Power BI dashboard that was created. Click Edit and Add a Tile, choose the Text Box, select the Display title, and provide the title and content.
- Select the Set custom link, LinkType - Link to a Dashboard and choose the Intel vPro® devices log report. Select Apply.
For other Device Logs:
- Hover over the Event Hub custom topic dataset you created, select More options menu and then select Create report.
- Follow the steps to Create a Table chart to show event hub data for other devices.
NOTE: Drag the fields to values and create a table chart but don’t select a filter for eventTime.- A table chart is created for logs of devices that are not based on Intel vPro® technology.
- Navigate to the Power BI dashboard that was created.
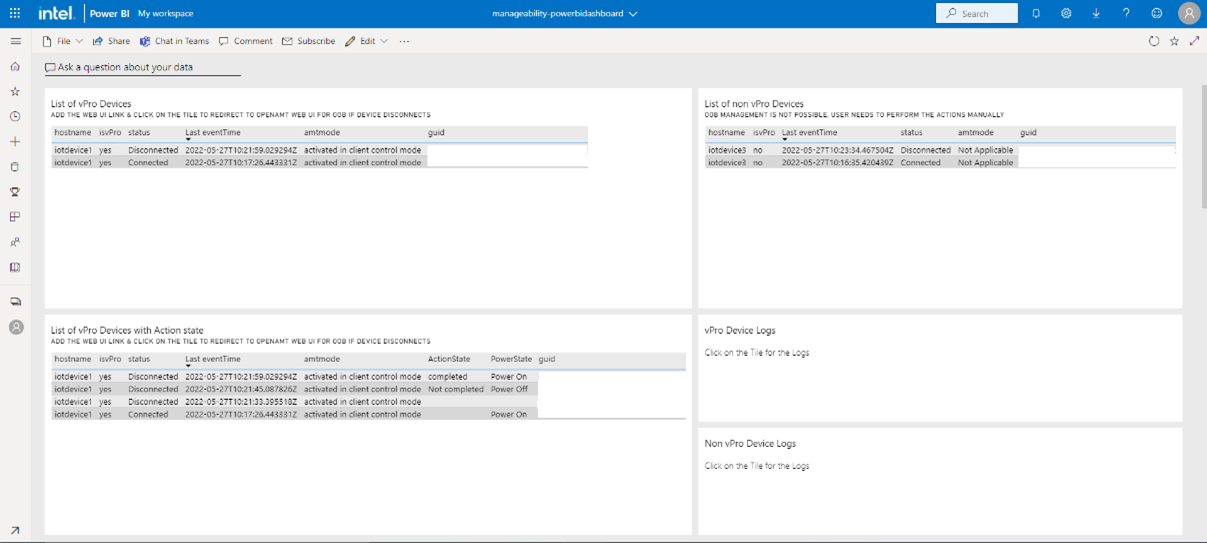
- Click the Edit and Add a Tile and choose the Text Box and select the Display title and provide the title and content. Select the Set custom link, LinkType-Link to a Dashboard and Choose the devices log report. Select Apply.Power BI Dashboard.
NOTE: For Intel vPro® enabled edge devices, click on the List of vPro Devices Tile and navigate to Open AMT Cloud Toolkit Sample Web UI and perform the OOB management.
Data for Intel vPro® Devices and other Device types:
For example, you can view the below telemetry data in Power BI for the Automated Checkout Reference Implementation:

Learn More
Learn more about Open AMT by reading about Open AMT GitHub Documentation.
Learn more about Azure at the following links:
- IoT Hub
- Event Hub Namespace
- Event Hub
- Azure Stream Analytics
- Configure Kong Gateway with CA signed certs
Troubleshooting
This section lists possible errors that may occur.
- For Open AMT Cloud Toolkit Microservices issues, refer to Troubleshooting guide.
- If Open AMT Cloud Toolkit configuration becomes unworkable, it may be necessary to clean up the environment by:
- Stop the UOB Server by running the following command.
sudo docker-compose down - Reset your environment completely by unprovisioning, also known as deactivating, the managed device.
To deactivate the Intel vPro® managed device, do the following steps:- Linux: Run the following command in a terminal:
sudo docker run --net host --device=/dev/mei0 intel/oact-rpc-go:latest deactivate -u wss://<hostipaddr or container_instance_fqdn:8443>/activate -n --password <ccmprofilepassword>
- Windows: Open the command prompt/terminal and navigate to the directory containing RPC Application.
Run the following command in Administrative mode:rpc deactivate -n -u wss://<hostipaddr or container_instance_fqdn:8443>/activate --password <ccmprofilepassword>
- Linux: Run the following command in a terminal:
- Shut down Open AMT Cloud Toolkit Docker containers.
- After resetting the environment, rerun the Open AMT Cloud Toolkit and uob-server containers.
- Stop the UOB Server by running the following command.
Additional Examples Using Azure IoT
This section contains the following examples:
- Automated Checkout Reference Implementation
- Intelligent Traffic Management Reference Implementation
- Social Distancing Detection for Retail Settings Reference Implementation
- Rotor Bearing Defect Detector Reference Implementation
Automated Checkout Reference Implementation
In this section, you will create an Azure IoT Central dashboard for the Automated Checkout reference implementation, run standalone Python code to fetch telemetry data using REST API client, and send data to the Azure IoT Central dashboard for visualizing telemetry data. You can utilize the rest of the Azure IoT Central services to meet your needs. You will be able to run this application in both the Ubuntu* Linux* and Azure IoT Edge for Linux on Windows* (EFLOW) environments.
Prerequisites
Before you continue, you must complete the following:
- Complete the steps to install and run the Automated Checkout reference implementation.
NOTE: These steps will result in building containers for the Linux environment. To build containers for the EFLOW environment, refer to the Deployment in Windows Environment section.
- If you have not done so already, install Connect Edge Device to Azure* IoT (See Step 5: Install the connect_devices_to_azure_iot in the Getting Started section above).
NOTE: You are not required to run the web app or any additional steps for the installation (i.e., you are just installing to access the scripts).
Deployment in Linux Environment
This section provides details on running the Automated Checkout RI in the Linux environment and two methods of visualization.
NOTE: Be sure you complete the Prerequisites described above.
Start the Automated Checkout RI
Follow the steps from the below documentation to build and start the Automated Checkout RI:
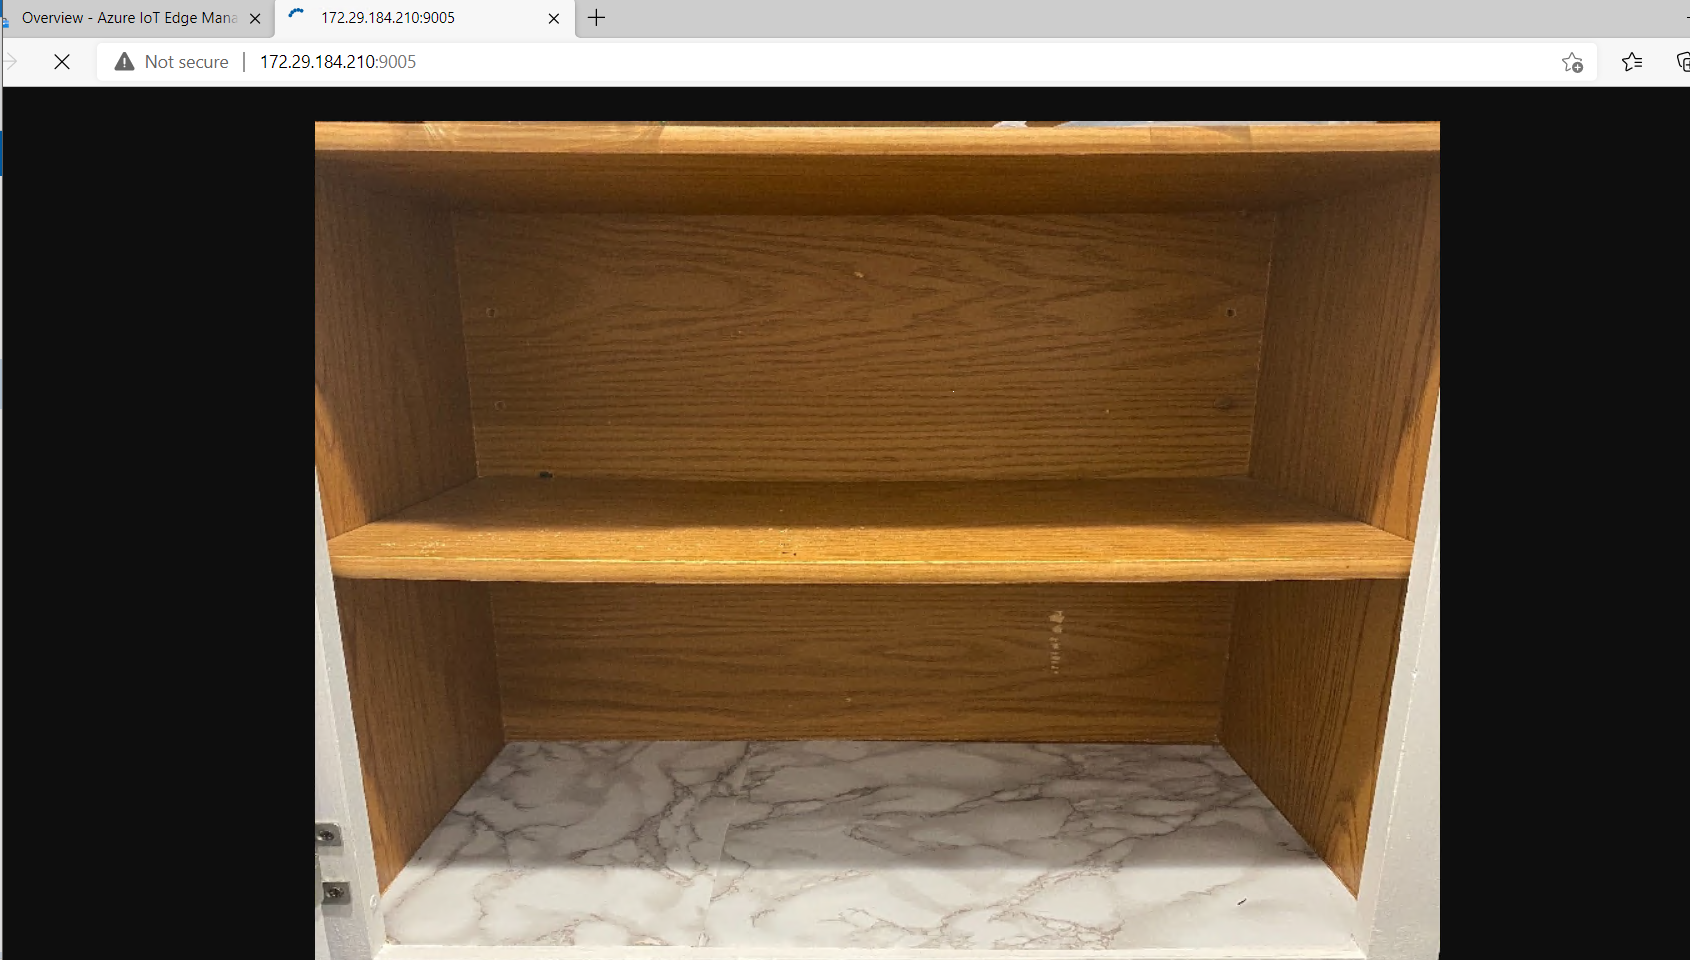
Visualization of Cooler
For visualization purposes, the Automated checkout serves the post-processed images over http. Open http://127.0.0.1:9005 on a web browser to observe how products are being added or removed from the cooler.
Deployment in Azure IoT Hub
To view the inference results in the Power BI dashboard, follow the instructions from Visualization of Azure IoT Hub instructions later in this guide.
Deployment in Azure IoT Central
To view the inference results in the IoT Central dashboard, follow the Visualization in Azure IoT Central instructions later in this guide.
Deployment in Windows EFLOW Environment
Azure IoT Edge for Linux on Windows (EFLOW) works by running a Linux virtual machine on a Windows device. The Linux virtual machine comes pre-installed with the IoT Edge runtime. Any IoT Edge modules deployed to the device runs inside the virtual machine. Meanwhile, Windows applications running on the Windows host device can communicate with the modules running in the Linux virtual machine.
EFLOW enables users to run production Linux-based cloud-native workloads on Windows IoT device, while providing only server mode access to VM and no GUI support.
Prerequisites
- If you have not done so already, install Connect Edge Device to Azure* IoT (See Step 5: Install the connect_devices_to_azure_iot in the Getting Started section above).
- Complete the steps to install and run the Automated Checkout reference implementation.
- If all the required containers are already available in Azure Container Registry (ACR) or any other container registry, go directly to the Set Up Azure Resources for Deployment section. If not, build and push the containers by following the steps below.
Build Automated Checkout Docker Images
Since some container images are not readily available for Automated Checkout, this section will provide details to create and upload the container images to Azure Container Registry. To make the Automated Checkout reference implementation work with Microsoft EFLOW, two container images need to be modified.
- Go to the reference implementation installation folder by executing the command:
cd Automated_Checkout_<version>/Automated_Checkout/automated-checkout - Run the command below to build the automated checkout services and create local Docker images:
NOTE: This step can be skipped if the Automated Checkout RI images are built and already available.sudo make build - Create custom mqtt dockerfiles:
NOTE: In the Automated Checkout RI, the edgex-device-mqtt and mqtt-broker Docker containers are mounting configuration files from the host machine filesystem at run time. For these containers to work on EFLOW, you must rebuild the images with the configuration files copied inside the image itself.
- Create a file named dockerfile.mqtt in the Automated_Checkout_<version>/Automated_Checkout/automated-checkout directory with the below content:
FROM eclipse-mosquitto:1.6.3 COPY res/mqtt/mosquitto.conf /mosquitto/config/mosquitto.conf CMD ["/usr/sbin/mosquitto", "-c", "/mosquitto/config/mosquitto.conf"] - Create a file named dockerfile.edgex-mqtt in the Automated_Checkout_<version>/Automated_Checkout/automated-checkout directory with the below content:
FROM edgexfoundry/docker-device-mqtt-go:1.2.0
COPY res/device-mqtt /res
- Create a file named dockerfile.mqtt in the Automated_Checkout_<version>/Automated_Checkout/automated-checkout directory with the below content:
- To build the mqtt docker images for the dockerfile created above, run the below commands:
sudo docker build -t edgex-device-mqtt:latest -f dockerfile.edgex-mqtt .
sudo docker build -t mqtt-broker:latest -f dockerfile.mqtt .
Push Automated Checkout Docker Images to ACR
NOTE: Azure IoT requires container images of edge modules to be available on a public/private container registry. Azure Container Registry allows you to build, store, and manage container images and artifacts in a private registry for all types of container deployments.
Follow the steps below to push Automated Checkout Docker images to ACR.
- To create an Azure Container Registry (ACR), use the following link: Creating a container registry.
- Go to Azure portal > container registry > choose your container registry > Access keys
Enable Admin user, get the details of container registry and please make a note of username, password, and login server for further steps.
- Open a terminal on your development machine.
- Set environmental variables as follows by running the following commands on the terminal.
export ACR_USERNAME=<ACR username> export ACR_LOGIN_SERVER=<ACR Login Server> -
Login to your Azure container registry. Enter the Azure container registry password when prompted.
sudo docker login -u $ACR_USERNAME $ACR_LOGIN_SERVER -
Tag all Automated Checkout Docker images:
sudo docker tag mqtt-broker:latest $ACR_LOGIN_SERVER/automated-checkout/mqtt-broker:latest sudo docker tag edgex-device-mqtt:latest $ACR_LOGIN_SERVER/automated-checkout/edgex-device-mqtt:latest sudo docker tag automated-checkout/ds-card-reader:dev $ACR_LOGIN_SERVER/automated-checkout/ds-card-reader:latest sudo docker tag automated-checkout/ds-controller-board:dev $ACR_LOGIN_SERVER/automated-checkout/ds-controller-board:latest sudo docker tag automated-checkout/ds-cv-inference:dev $ACR_LOGIN_SERVER/automated-checkout/ds-cv-inference:latest sudo docker tag automated-checkout/as-controller-board-status:dev $ACR_LOGIN_SERVER/automated-checkout/as-controller-board-status:latest sudo docker tag automated-checkout/as-vending:dev $ACR_LOGIN_SERVER/automated-checkout/as-vending:latest sudo docker tag automated-checkout/ms-authentication:dev $ACR_LOGIN_SERVER/automated-checkout/ms-authentication:latest sudo docker tag automated-checkout/ms-inventory:dev $ACR_LOGIN_SERVER/automated-checkout/ms-inventory:latest sudo docker tag automated-checkout/ms-ledger:dev $ACR_LOGIN_SERVER/automated-checkout/ms-ledger:latest -
Push all Automated Checkout Docker images to ACR:
sudo docker push $ACR_LOGIN_SERVER/automated-checkout/mqtt-broker:latest
sudo docker push $ACR_LOGIN_SERVER/automated-checkout/edgex-device-mqtt:latest
sudo docker push $ACR_LOGIN_SERVER/automated-checkout/ds-card-reader:latest
sudo docker push $ACR_LOGIN_SERVER/automated-checkout/ds-controller-board:latest
sudo docker push $ACR_LOGIN_SERVER/automated-checkout/ds-cv-inference:latest
sudo docker push $ACR_LOGIN_SERVER/automated-checkout/as-controller-board-status:latest
sudo docker push $ACR_LOGIN_SERVER/automated-checkout/as-vending:latest
sudo docker push $ACR_LOGIN_SERVER/automated-checkout/ms-authentication:latest
sudo docker push $ACR_LOGIN_SERVER/automated-checkout/ms-inventory:latest
sudo docker push $ACR_LOGIN_SERVER/automated-checkout/ms-ledger:latest
Build Docker Image for Connect Edge Devices to Azure IoT Module
This section outlines sending Automated Checkout telemetry data to the cloud.
NOTE: If you have not done so already, install Connect Edge Devices to Azure* IoT (See Step 5: Install the connect_devices_to_azure_iot).
To make the Connect Edge Devices to Azure IoT work with Azure EFLOW, build it as container.
1. Go to Connect_Edge_Devices_to_Azure_IoT folder in Desktop:
cd ~/Desktop/Connect_Edge_Devices_to_Azure_IoT
2. Build Docker image:
sudo docker build . -t connect-edge-devices-to-azure-iot:latest
Push Connect Edge Devices to Azure IoT Docker Images to ACR
Follow the steps below to push Connect Edge Devices to Azure IoT Docker images to ACR.
1. Tag Connect Edge devices to Azure IoT container:
sudo docker tag connect-edge-devices-to-azure-iot:latest $ACR_LOGIN_SERVER/connect-edge-devices-to-azure-iot:latest
2. Push the container to ACR:
sudo docker push $ACR_LOGIN_SERVER/connect-edge-devices-to-azure-iot:latest
Set Up Azure Resources for Deployment
Before deploying the Automated Checkout Reference Implementation and Connect Edge devices to Azure IoT modules on EFLOW, you must complete the following steps.
Create Azure IoT Hub
1. Follow the Create an IoT hub using the Azure portal instructions.
2. In your Azure Portal, go to your IoT Hub.
3. Under Device Management from the menu on the left, select IoT Edge.
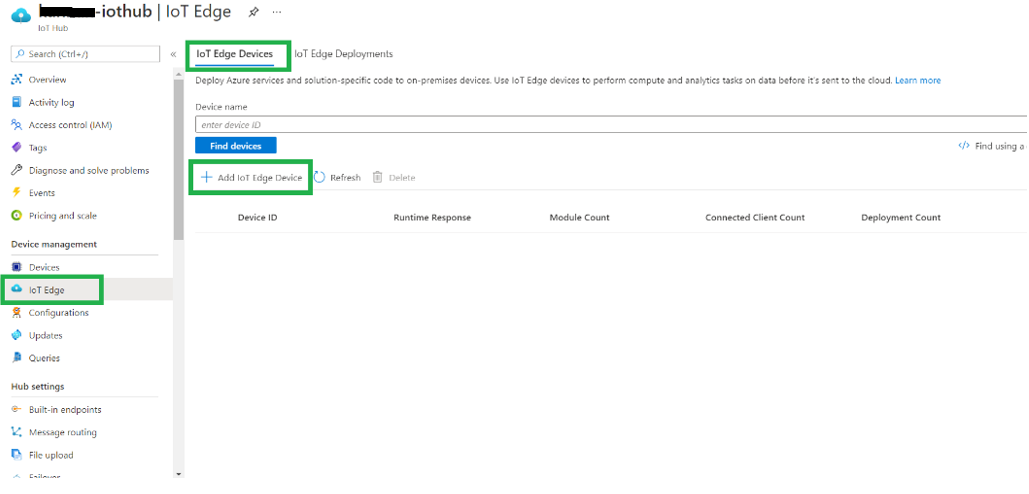
4. Click on Add IoT Edge Device to create a new edge device for EFLOW VM. Provide a device ID and click the Save button.
5. Select the device ID of the target device you just created. Make a note of primary connection string for future reference.
Create Microsoft EFLOW device
To create an EFLOW device, follow the Microsoft installation guide.
During the provisioning step, choose manual provisioning and provide the connection string of your IoT hub.
Deploy Reference Solution in EFLOW
NOTE: The following step assumes that all Docker images related to Automated Checkout RI and Connect Edge Devices to Azure IoT RI are pushed to Azure Container Registry. If not completed, follow the Build Automated Checkout Docker Images for the steps to be followed.
Set Up Microsoft Visual Studio Code and Extensions
In this section we will be using the Azure IoT Extensions for Visual Studio Code to develop IoT Edge Modules.
Azure IoT Tools for VS Code is an extension pack for Visual Studio Code that lets you get all you need for Azure IoT development with 1-click installation. Microsoft Azure IoT support for Visual Studio Code is provided through a rich set of extensions that make it easy to discover and interact with Azure IoT Hub that power your IoT Edge and device applications.
- Install Visual Studio Code on your development machine.
- Once the installation is finished, select View > Extensions.
- Search for Azure IoT Tools, which is actually a collection of extensions that help you interact with IoT Hub and IoT devices, as well as developing IoT Edge modules.
- Select Install. Each included extension installs individually.
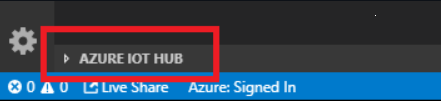
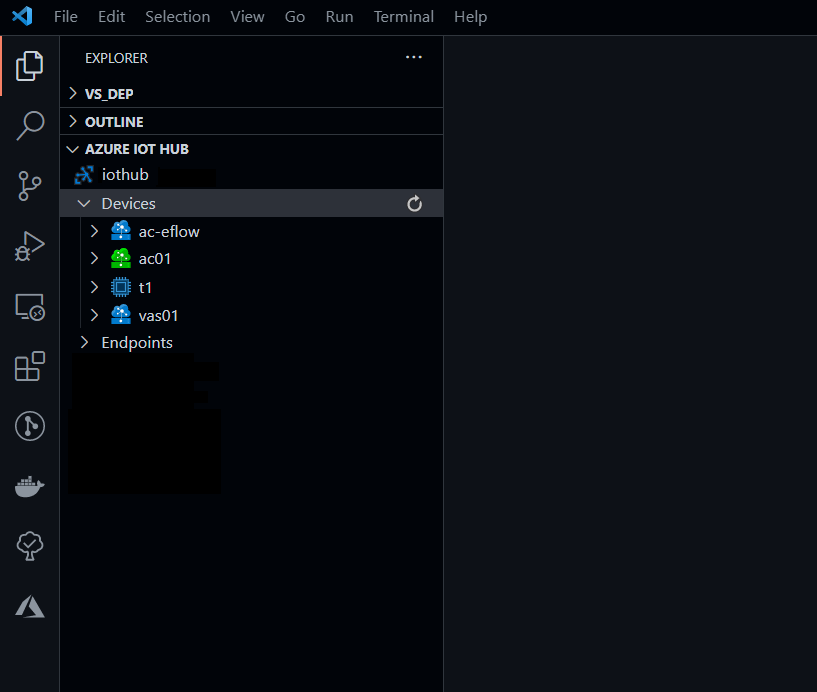
- In Explorer of VS Code, click Azure IoT Hub Devices in the bottom left corner.
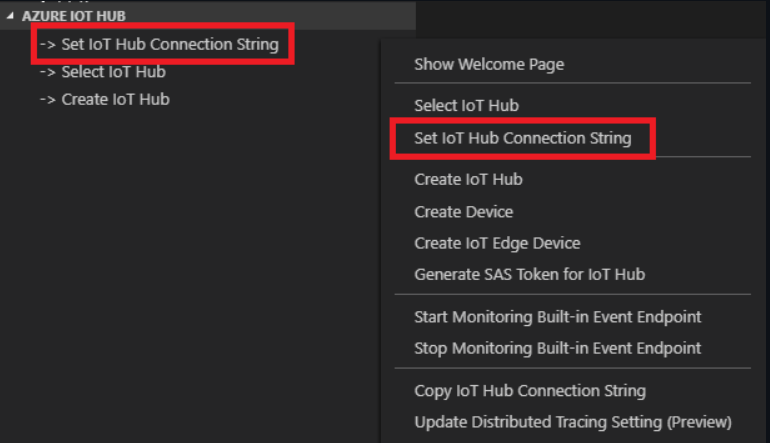
- Click Set IoT Hub Connection String in the context menu.
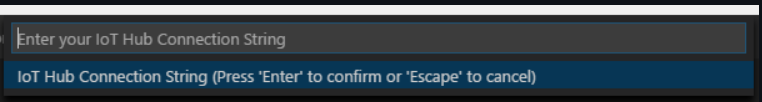
- An input box will pop up, then enter your IoT Hub Connection String.
This is a one-time configuration. Make sure it is IoT Hub Connection String and not Device Connection String.
The format is: HostName=<my-hub>.azure-devices.net;SharedAccessKeyName=<my-policy>;SharedAccessKey=<my-policy-key>)
- The device list will be shown:
Deploying modules to device
For deploying the Automated Checkout RI modules to IoT Edge device that was created, follow the below steps.
- Open the Connect to Edge Device Automated Checkout RI folder (AC_Azure_IoT) on your Visual Studio Code using the option File > Open Folder.
- Expand the eflow_deployment_manifest folder to see the deployment files.
- Update the .env file with the required details of Azure Container Registry that was created and save the file.
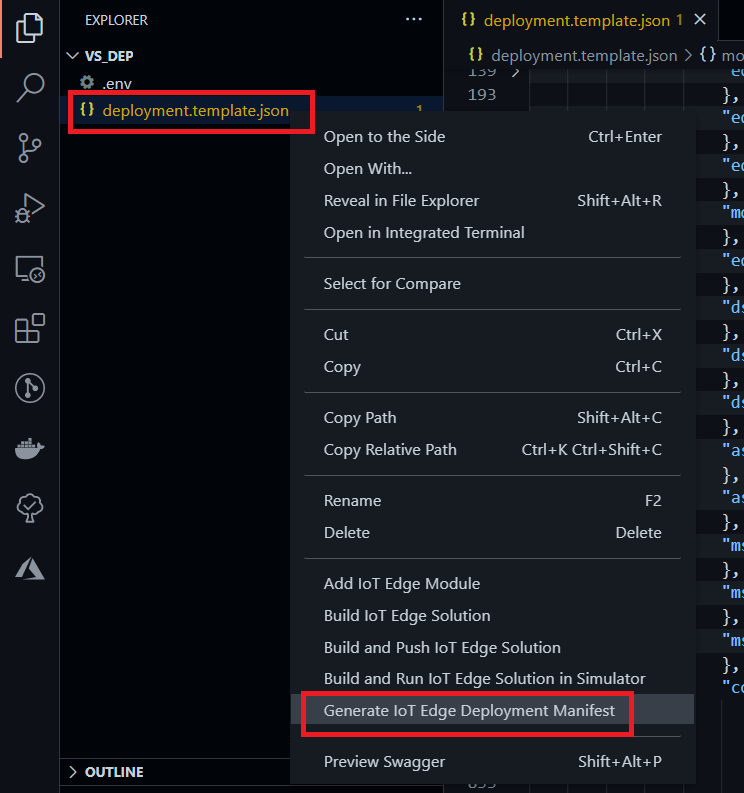
- Right-click the deployment.template.json file and select Generate IoT Edge Deployment Manifest to generate the deployment manifest.
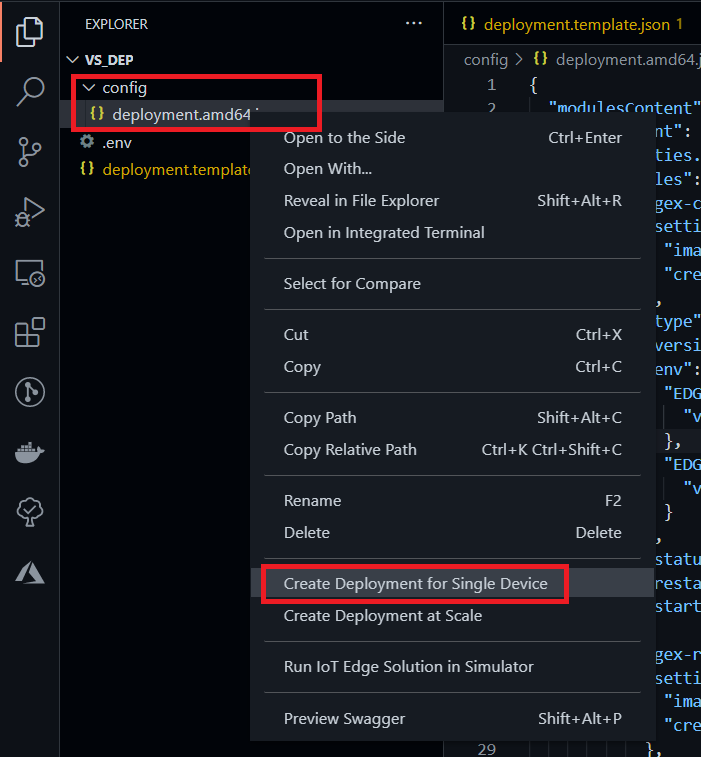
- The generated deployment manifests will appear under a new config directory. Right-click on the deployment.amd64.json file under config folder and select Create Deployment for Single Device.
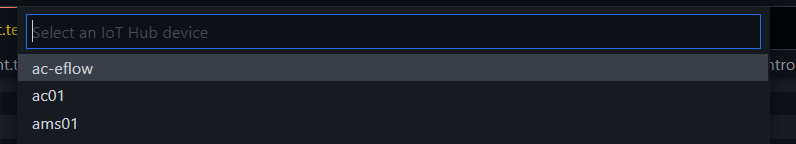
- An input box will pop up with options to select from the IoT Edge Device. Select the IoT Edge device name that was created.
- Click Azure IoT Hub Devices in the bottom left corner and expand the Modules of the IoT Edge device selected on the previous step.
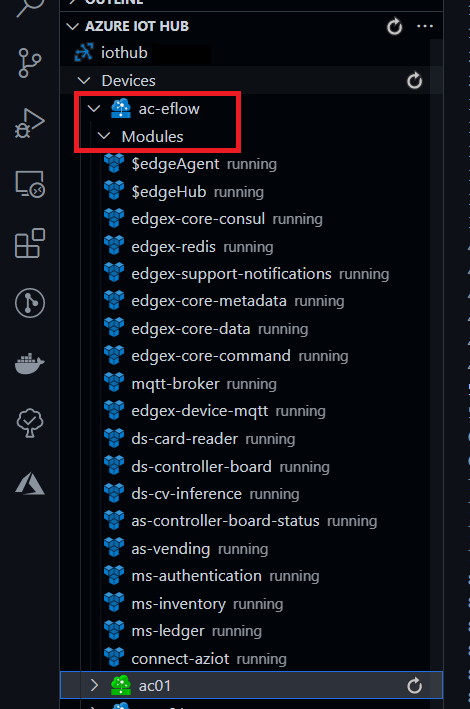
NOTE: Depending on the network speed of the edge machine, it might take a while to deploy all the modules.
Monitoring Edge Device
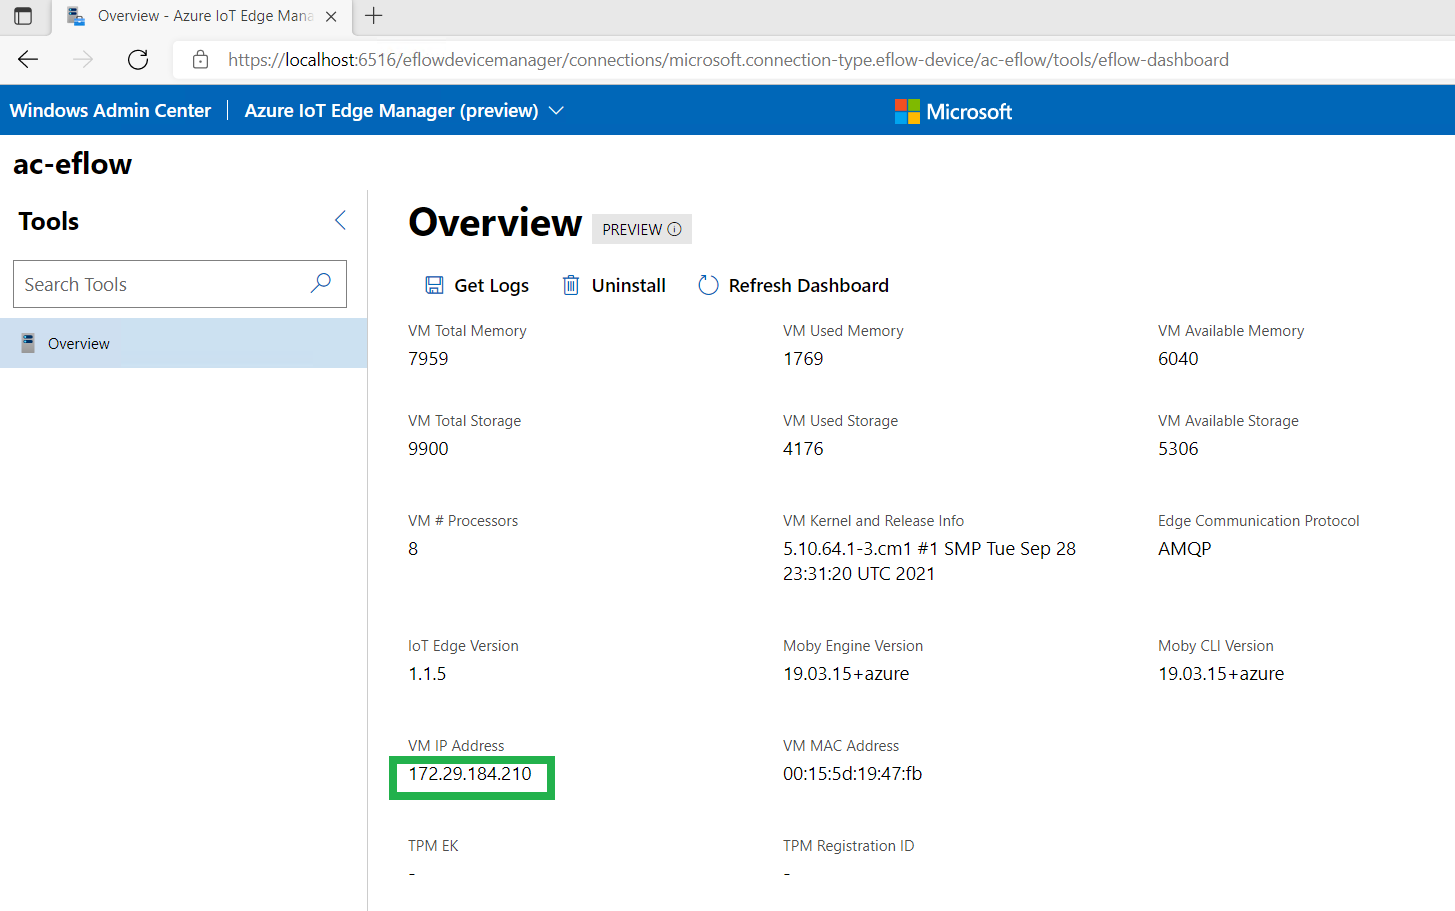
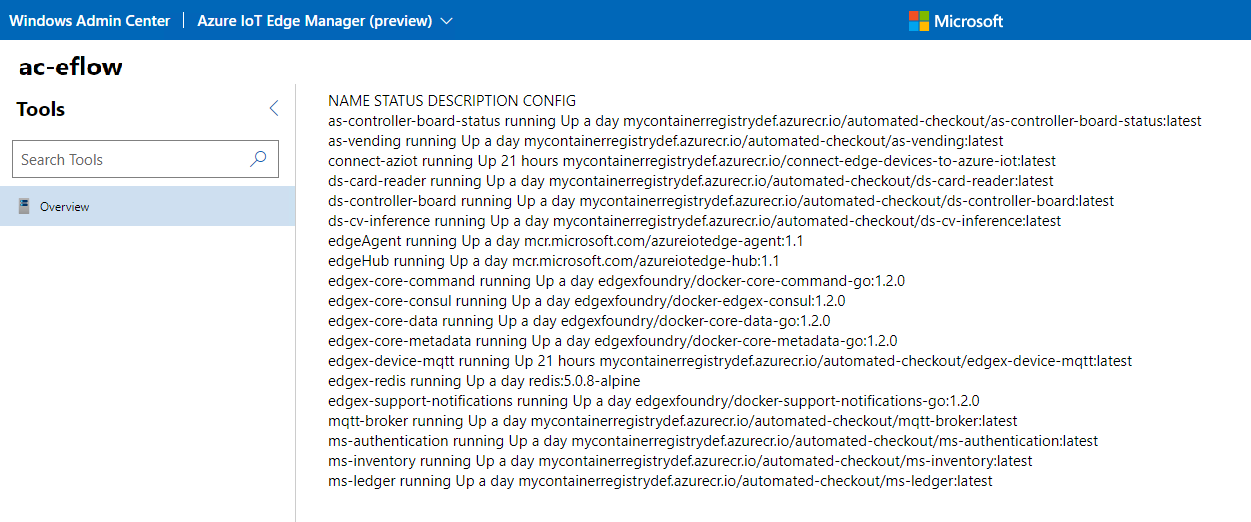
Using Windows Admin Center
After successful setup/deployment of EFLOW, you can connect to your EFLOW VM from Windows Admin Center and see the status of your edge modules as shown below:
NOTE: Make a note of the IP address for viewing visualization of the cooler.
Using Windows PowerShell
- Connect to your EFLOW VM from your Windows machine by executing this command in PowerShell:
Connect-EflowVM -
Run the below command to see the deployed list of edge modules:
sudo iotedge list
You should see output similar to:
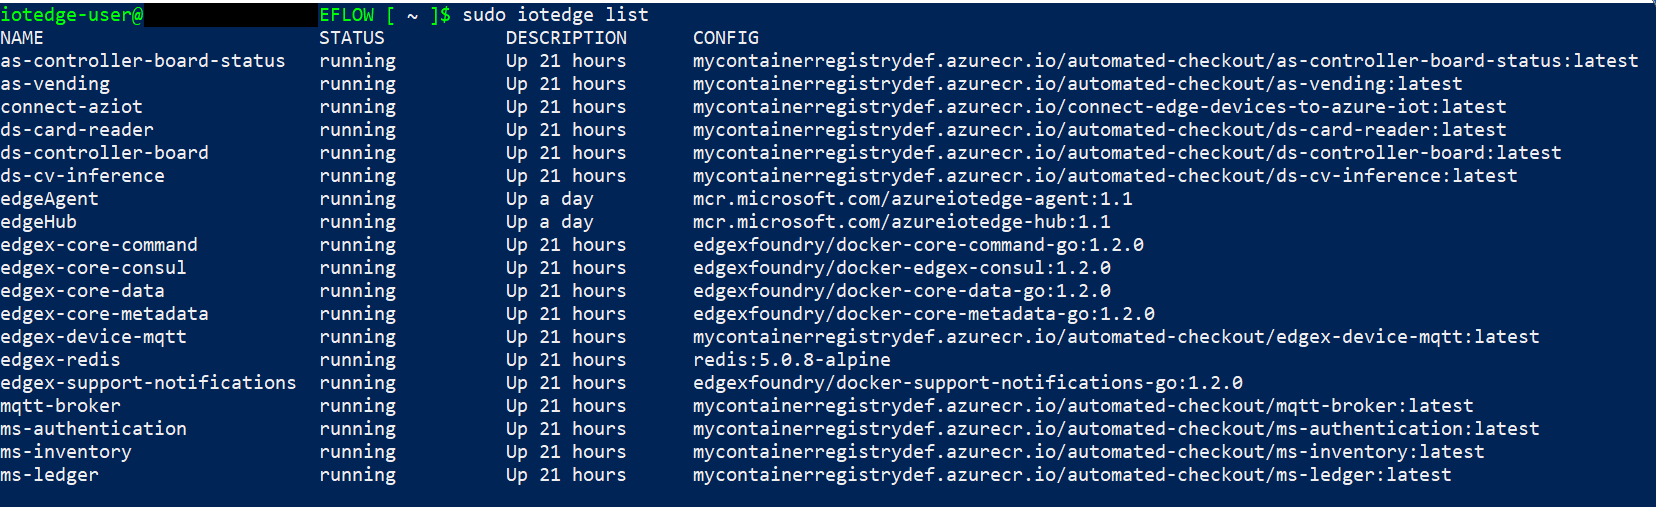
-
To check the logs of edge modules, execute the command:
sudo iotedge logs <edge module name>
Visualization of Cooler
To view the cooler simulation video, open a browser on the Windows machine that hosts the EFLOW VM and navigate to <EFLOW VM IP address>:9005
Visualization of Azure IoT Hub Data
Microsoft Azure IoT Hub is used for bidirectional communication and to optimize the process of connecting IoT devices to Azure cloud services.
This section covers the topics below:
- Creation of Azure IoT Hub and Microsoft* Power BI* for visualization.
- Creation and configuration of Azure Stream Analytic Job to query information from database.
- Operation of connect script to collect and send data to Azure IoT Hub.
- Visualization of data in Power BI dashboard.
If you have already created an IoT Hub in Azure, skip to Step 2 below.
Step 1: Create an Azure IoT Hub
- Follow the Create an IoT hub using the Azure portal instructions to create IoT Hub.
- In your Azure Portal, go to your IoT Hub.
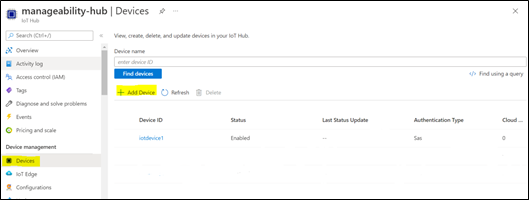
- Under Device Management from the menu on the left, select Devices.
- Click on Add Device to create a new device. Provide a device ID and click the Save button.
- Select the device ID of the target device you just created. Make a note of the primary connection string for future reference.
Step 2: Create a Power BI Account
Power BI is a collection of software services, apps, and connectors that work together to turn unrelated sources of data into coherent, visually immersive, and interactive insights. In the Power BI service, dashboards and reports connect to datasets that brings all the relevant data together in one place.
If you already have a Power BI account, you can skip this step. Otherwise, create a Power BI account here.
Step 3: Create Stream Analytics Job
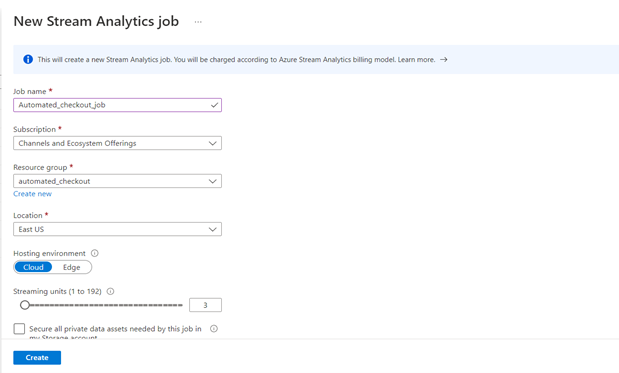
- In the Azure portal, select create a resource, choose Stream Analytics Job.
- In the Stream Analytics job overview page, select Create.
- Give a name and select the Resource group and Location same as which is used for creating IoT Hub and select Create.
Step 4: Configure Stream Analytics Job
You must configure an input and an output to use a Azure Stream Analytics job. Follow the below steps for configuring input and output.
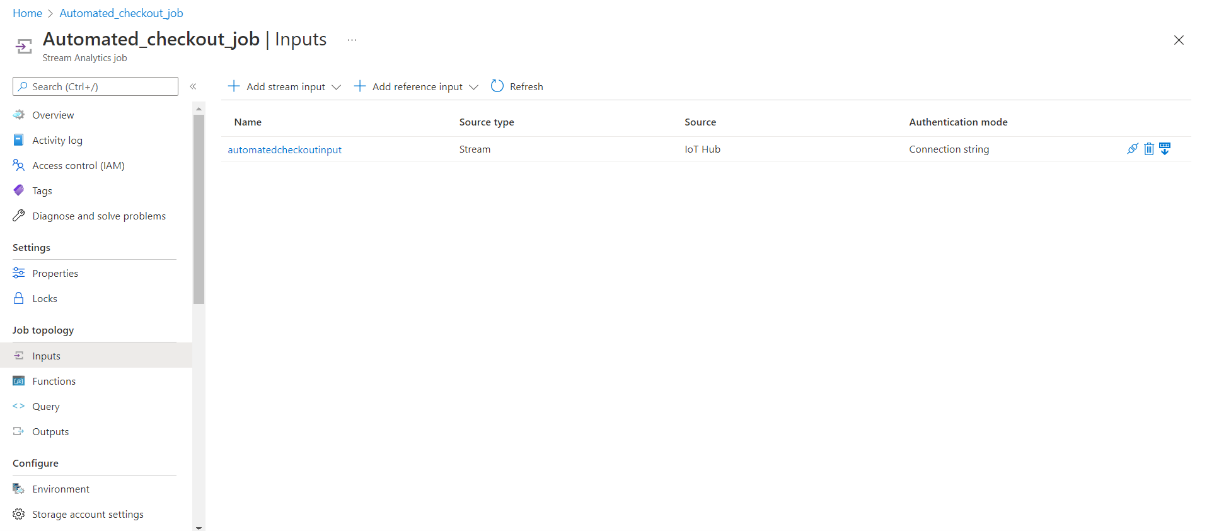
Step 4.1: Add IoT Hub as Input to the Stream Analytics Job
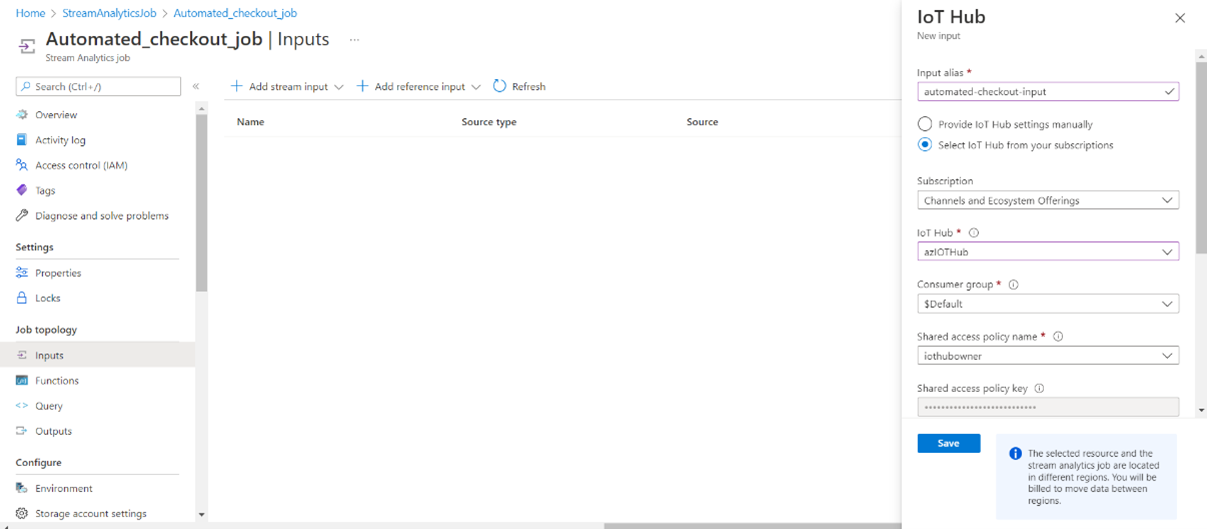
- Open the Stream Analytics job.
- Under Job topology > select Inputs.
- In the Inputs pane, select Add stream input, then select IoT Hub from the drop-down list.
On the new input pane, enter the following information:- Input alias: Enter a unique alias for the input. For example, automated-checkout-input
- Select IoT Hub from your subscription: Select this radio button.
- Subscription: Select the Azure subscription you're using.
- IoT Hub: Select the IoT Hub you have created from the above section.
- Consumer Group: Select the consumer group you have created for IoT Hub.
- Endpoint: Select Messaging.
- Shared access policy name: Select the “service”.
- Shared access policy key: This field is auto filled based on your selection for the shared access policy name.
- Leave all other fields at their defaults.
- Select Save.
Step 4.2: Add Power BI as Output to the Stream Analytics Job
- Under Job topology > select Outputs.
- In the Outputs pane > select Add > select Power BI from the drop-down list for visualizing the event hub data.
- On the Power BI - New output pane, select Authorize and follow the prompts to sign into your Power BI account.
- After you've signed into Power BI, enter the following information:
- Output alias: A unique alias for the output (ex: automatedcheckoutschema1).
- Group workspace: Select your target group workspace.
- Dataset name: Enter a dataset name (ex: schema1dataset).
- Table name: Enter a table name (ex: schema1table).
- Authentication mode: Leave at the default.
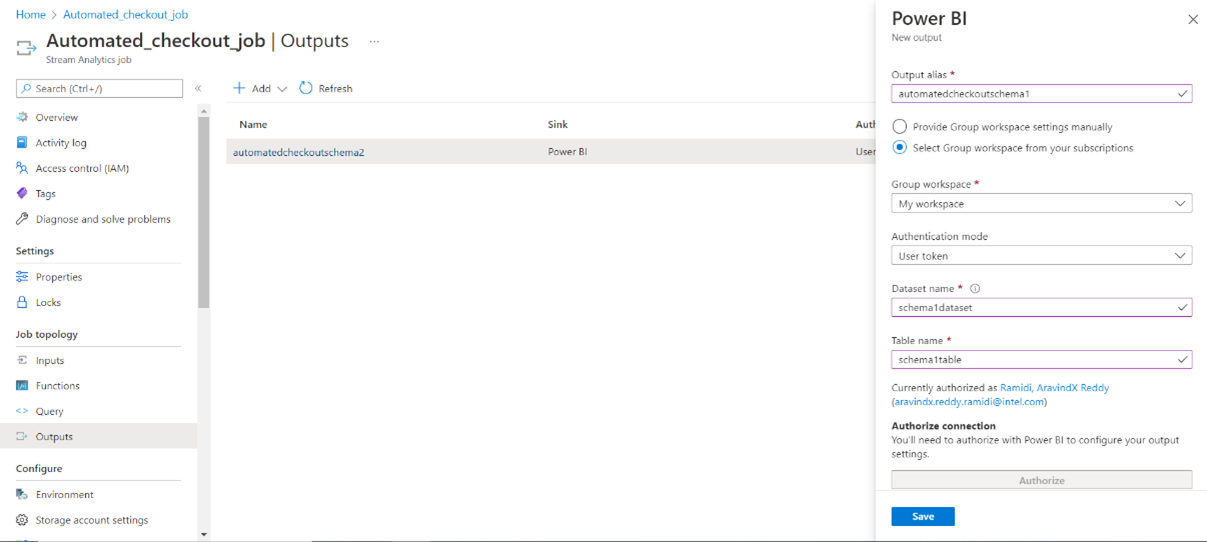
- Similarly, create another Power BI output with the following information:
- Output alias: A unique alias for the output (ex: automatedcheckoutschema2).
- Group workspace: Select your target group workspace.
- Dataset name: Enter a dataset name (ex: schema2dataset).
- Table name: Enter a table name (ex: schema2table).
- Authentication mode: Leave at the default.
- Select Save. Both outputs will be listed as shown below.
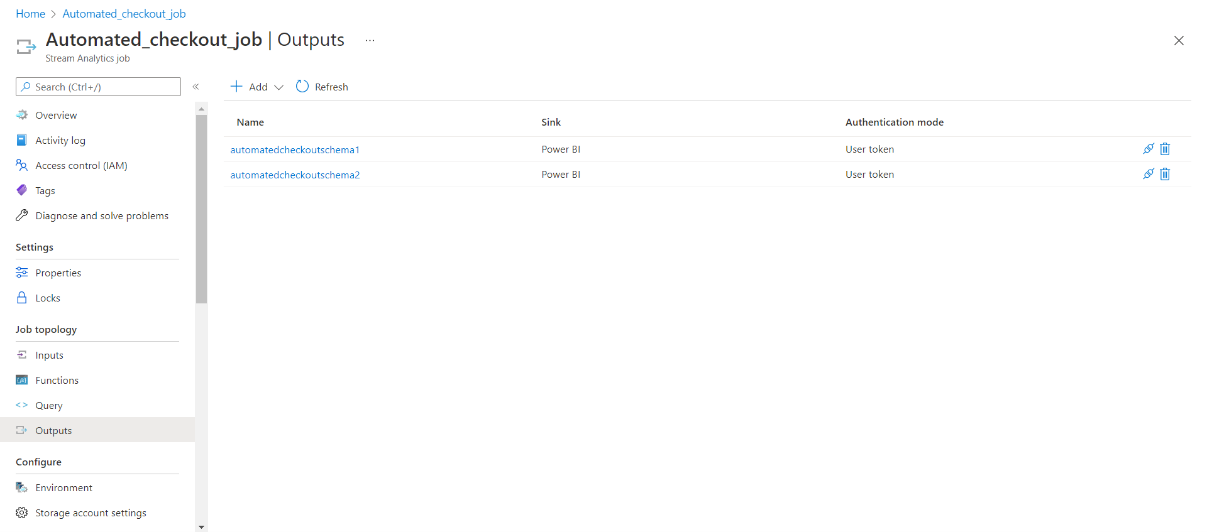
Step 4.2: Configure the Query for the Stream Analytics Job
Replace the query with the below:
SELECT

    IoTHub.ConnectionDeviceId as hostname,

    temperature, humidity, EventEnqueuedUtcTime

INTO
    automatedcheckoutschema2

FROM

    automatedcheckoutinput

WHERE temperature IS NOT NULL and humidity IS NOT NULL

SELECT
IoTHub.ConnectionDeviceId as hostname,
sprite.itemPrice as spriteitemprice,
sprite.productName  as sprite_productName,sprite.unitsOnHand as sprite_unitsOnHand, sprite.maxRestockingLevel as sprite_maxRestockingLevel,
mountain_dew.itemPrice as mountain_dew_itemPrice,mountain_dew.productName as mountain_dew_productName,mountain_dew.unitsOnHand as mountain_dew_unitsOnHand, mountain_dew.maxRestockingLevel as mountain_dew_maxRestockingLevel,
gatorade.itemPrice as gatorade_itemPrice,gatorade.productName as gatorade_productName,gatorade.unitsOnHand as gatorade_unitsOnHand, gatorade.maxRestockingLevel as gatorade_maxRestockingLevel,
Pringles.itemPrice as Pringles_itemPrice,Pringles.productName as Pringles_productName,Pringles.unitsOnHand as Pringles_unitsOnHand, Pringles.maxRestockingLevel as Pringles_maxRestockingLevel,
Ruffles.itemPrice as Ruffles_itemPrice,Ruffles.productName as Ruffles_productName,Ruffles.unitsOnHand as Ruffles_unitsOnHand, Ruffles.maxRestockingLevel as Ruffles_maxRestockingLevel,
EventEnqueuedUtcTime
INTO
automatedcheckoutschema1
FROM
automatedcheckoutinput
WHERE sprite IS NOT NULL and mountain_dew IS NOT NULL and gatorade is NOT NULL and Pringles IS NOT NULL and Ruffles IS NOT NULL
Step 4.4: Run the Application on the IoT Edge Device
- Go to the AC_Azure_IoT directory:
cd ~/Desktop/Connect_Edge_Devices_to_Azure_IoT/AC_Azure_IoT/
- Execute the below commands:
Where:chmod +x connect.sh sudo -s ./connect.sh -a IOT_Hub -c <IoT Hub connection String> -p <HOST_IP> -i <Interval> -m <true/false>
- <IoT Hub connection String> is the string you created earlier.
- <HOST_IP> is the IP of the machine on which the Automated checkout RI is running.
To view the host IP in Ubuntu, execute the command below:
If Automated checkout is running in same machine from where you run connect.sh, you can use 127.0.0.1 as host IP.hostname -I - -i <Interval> is the metric sending interval.
- Set the –m argument to true to enable the manageability feature. (Default value = false)
For example:
./connect.sh -a IOT_Hub -c “HostName=XXXIOTHub.azure-devices.net;DeviceId=XXXDeviceid;SharedAccessKey=o/AKq/3SDxJC0AWAXXXXXXXXXX=" -p 127.0.0.1 -i 1 –m true
Step 4.5: Run the Stream Analytics Job
In the Stream Analytics job, select Overview, then select Start > Now > Start. Once the job successfully starts, the job status changes from Stopped to Running.
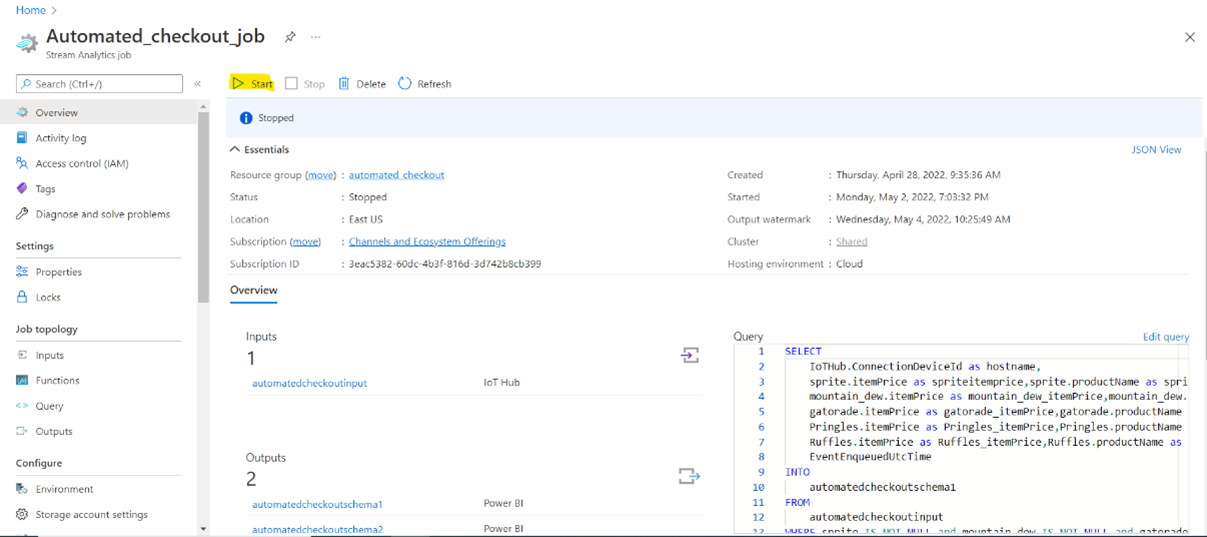
Step 4.6: Visualize the Telemetry Output on IoT Hub Terminal
Run the below command in PowerShell of Azure IoT Hub terminal.
az iot hub monitor-events -n <iothub_name> -d <device_id>
You will see output similar to:
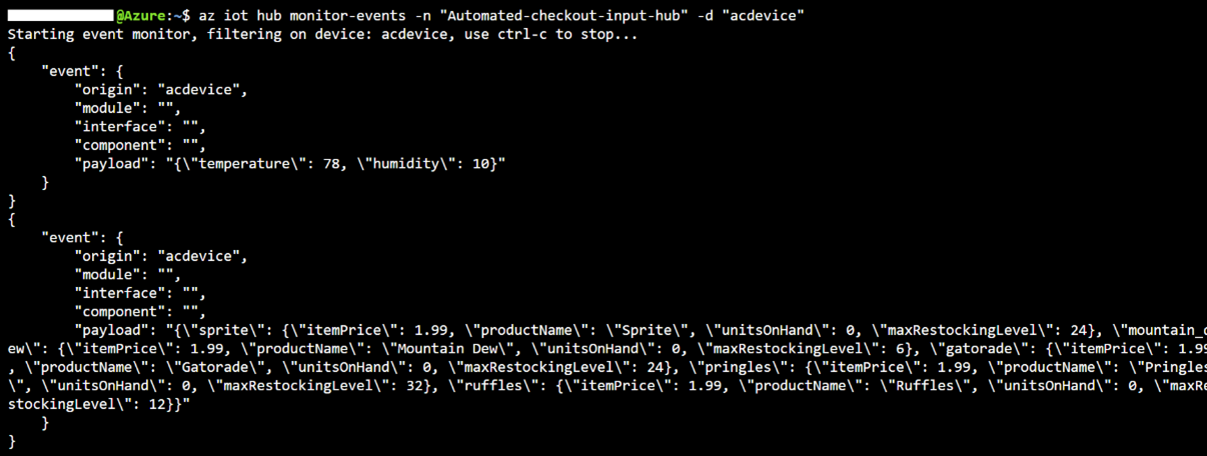
Step 4.7: Visualize the Dashboard on Power BI
-
Sign in to your Power BI account and select Power BI service from the top menu.
-
Select the workspace you used from the side menu, My Workspace.
-
Under the All tab or the Datasets + dataflows tab, you should see the dataset that you specified when you created the output for the Stream Analytics job.
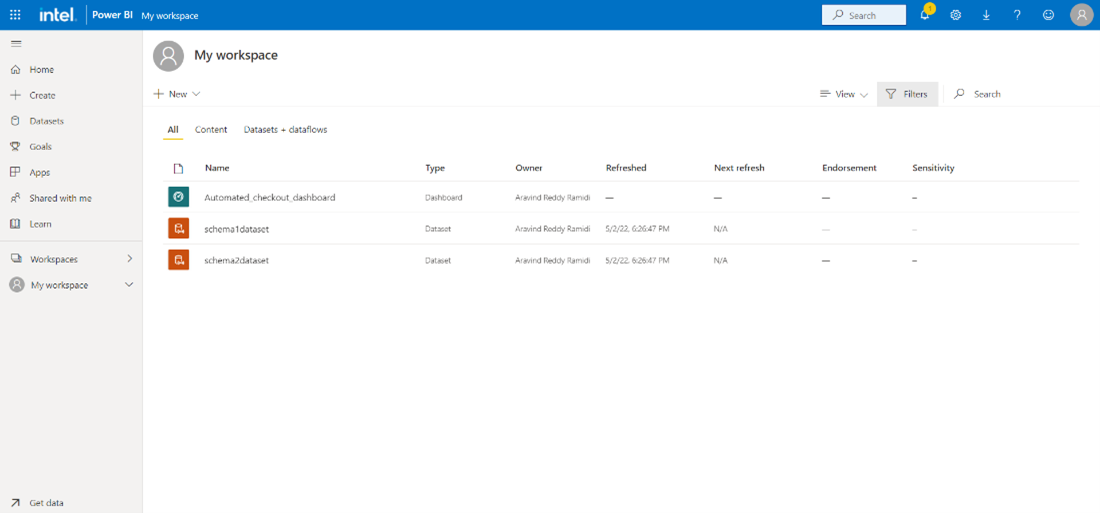
-
Go to the top part of the same window and select New > Dashboard.
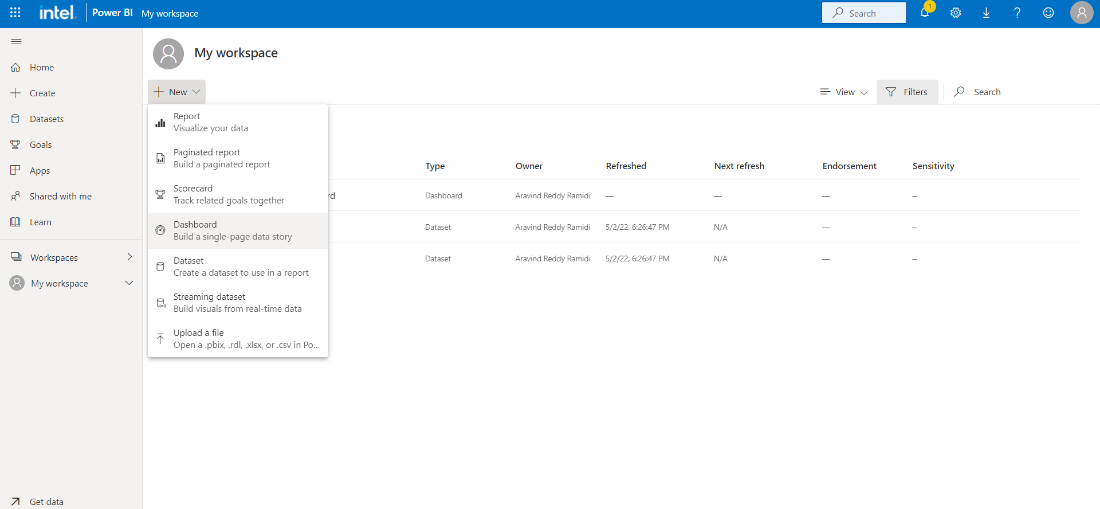
-
Put in a descriptive name and click on Create.
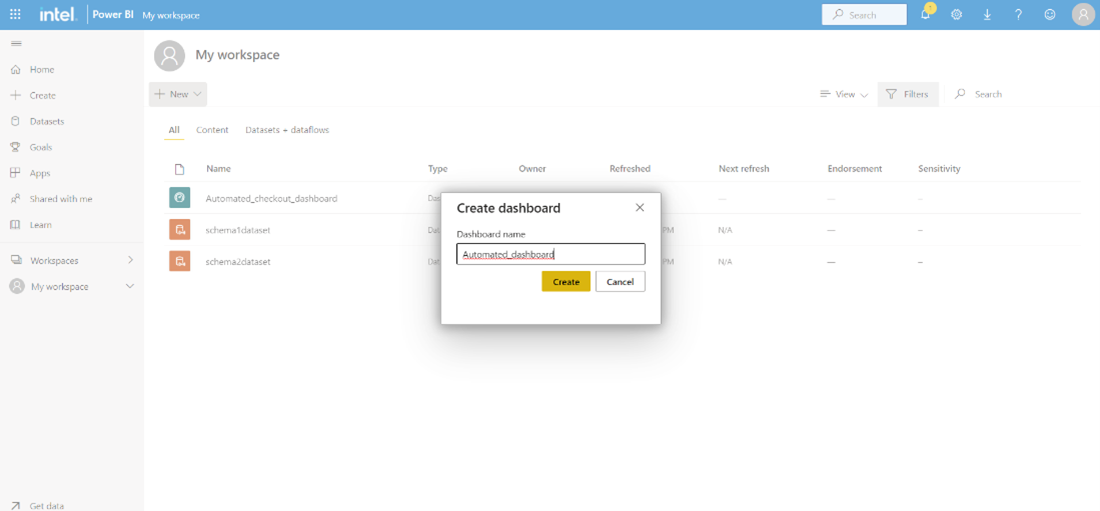
-
The new dashboard will open automatically. Next you can create your first visualization, for this go to Edit > Add a tile.
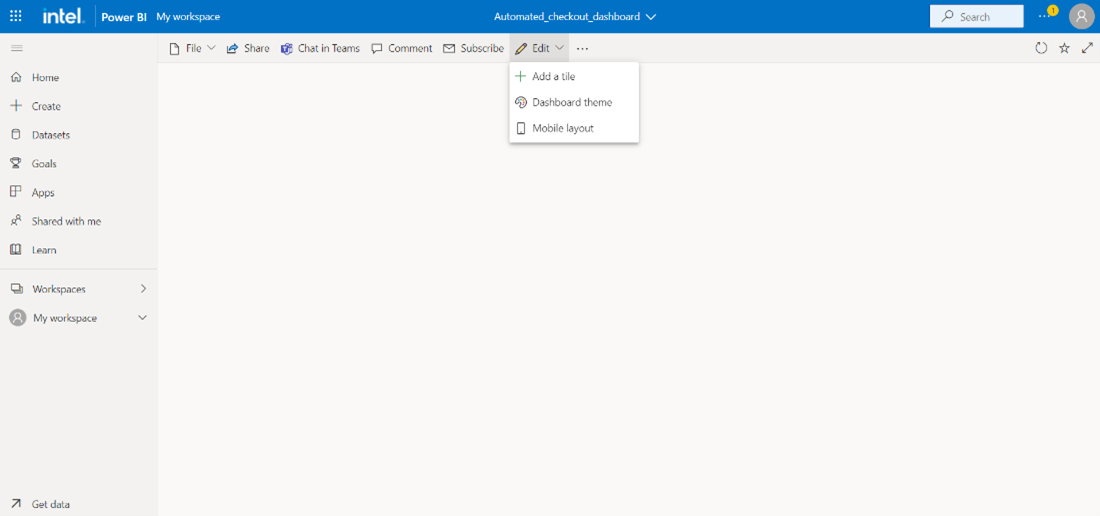
-
In the new window select Custom Streaming Data, and then click on Next.
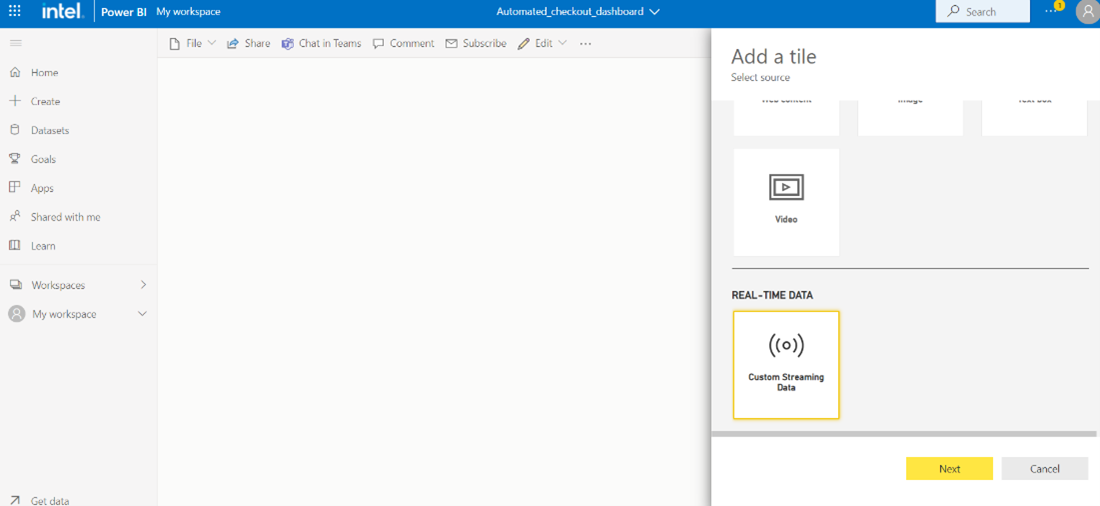
-
Select the dataset (schema1dataset,schema2dataset) created by the Stream Analytics job, and click on Next.
For temperature and humidity, select schema2dataset.

-
Select Card for visualization type. Under Fields, click Add value, then select the desired attribute, such as temperature, humidity.
Click Apply to save the tile to your dashboard.
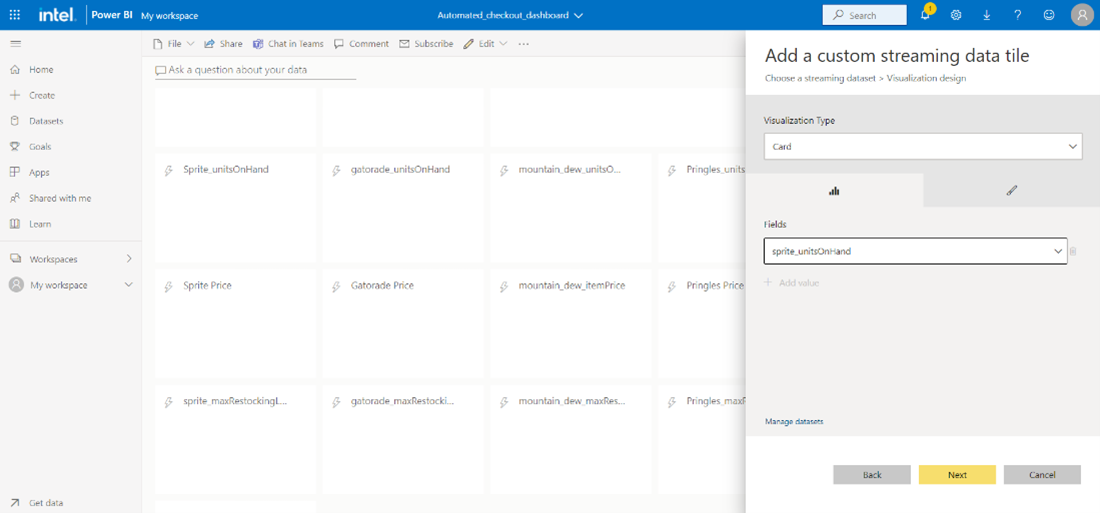
-
For Line Chart, follow the instructions below.
-
Select Line chart for visualization type.
-
Under Axis, click Add value then select EventEnqueuedUtcTime.
-
Under Values, click Add value, then select sprite_unitsOnHand, mountain_dew_unitsOnHand, pringles_unitsOnHand
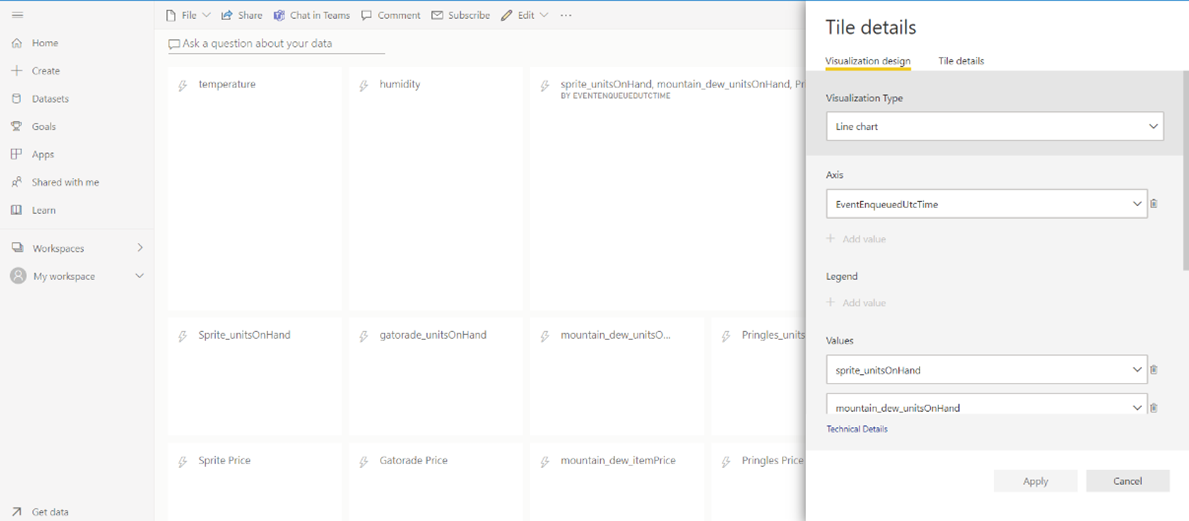
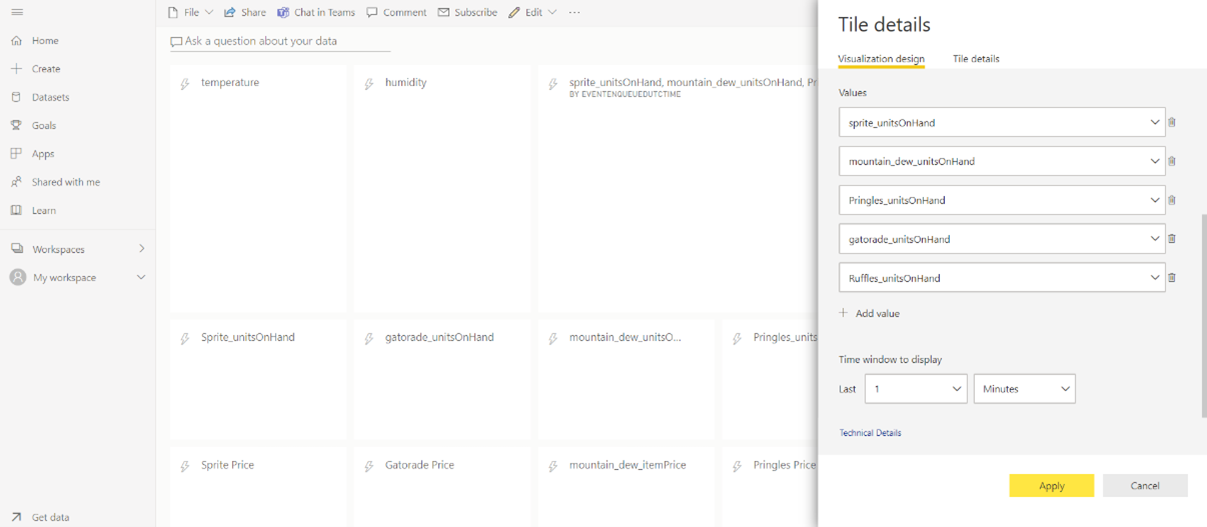
-
-
You will see a dashboard similar to below.
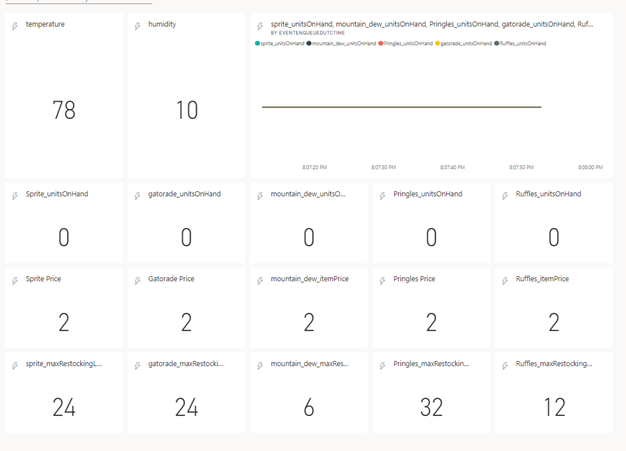
Visualization in Azure IoT Central
This section contains instructions for both Linux and EFLOW.
Step 1: Create Azure IoT Central Dashboard
- To create an Azure IoT Central dashboard, follow these instructions.
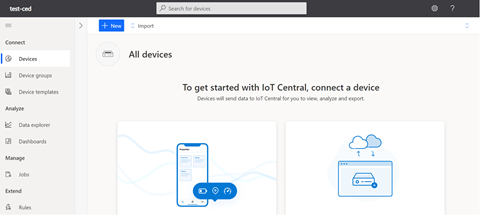
Step 2: Create Device Template
- To create a device template, follow these steps:
- Go to the Azure IoT Central application that you created in step 1, then navigate to Device templates and choose +New.
- On the Select template type page, choose the IoT Device tile. Then select Next: Customize.
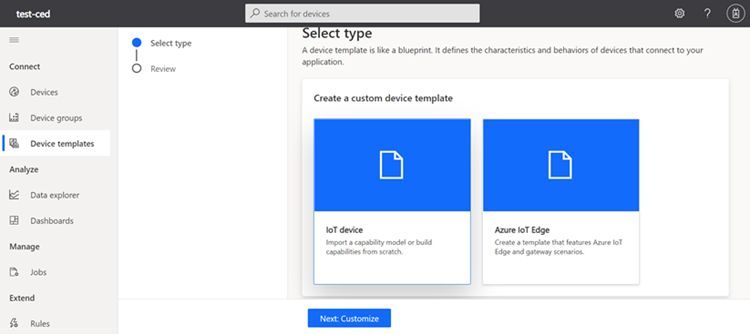
- On the Customize page, provide a name for the device template and select Next: Review.
NOTE: You do not need to select the check box for Gateway device with downstream devices.
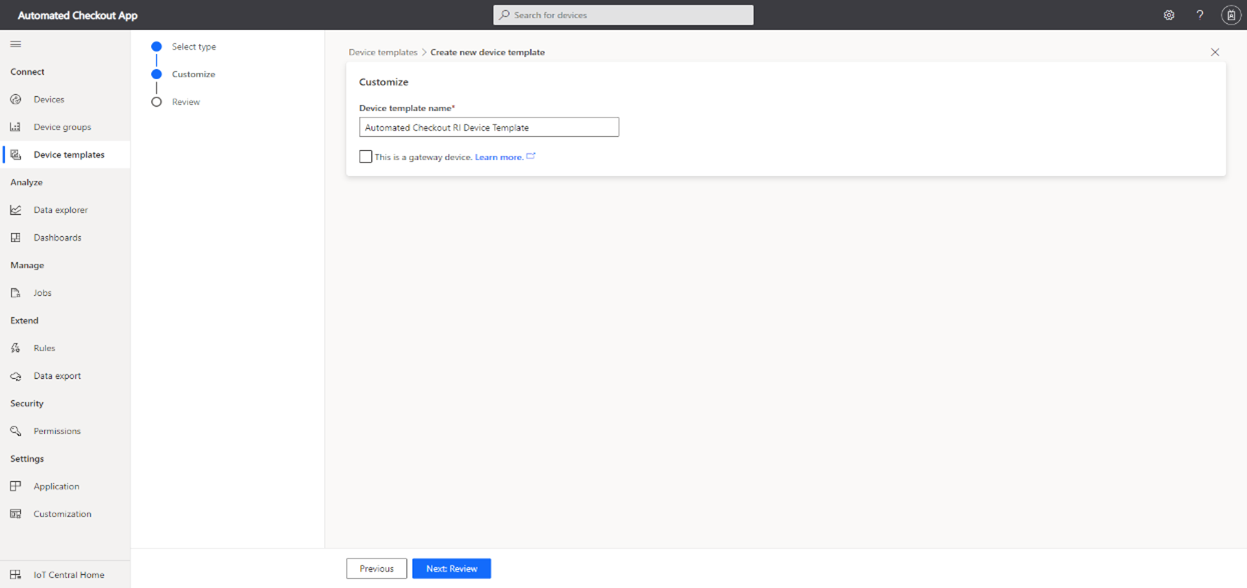
- On the Review page, select Create.
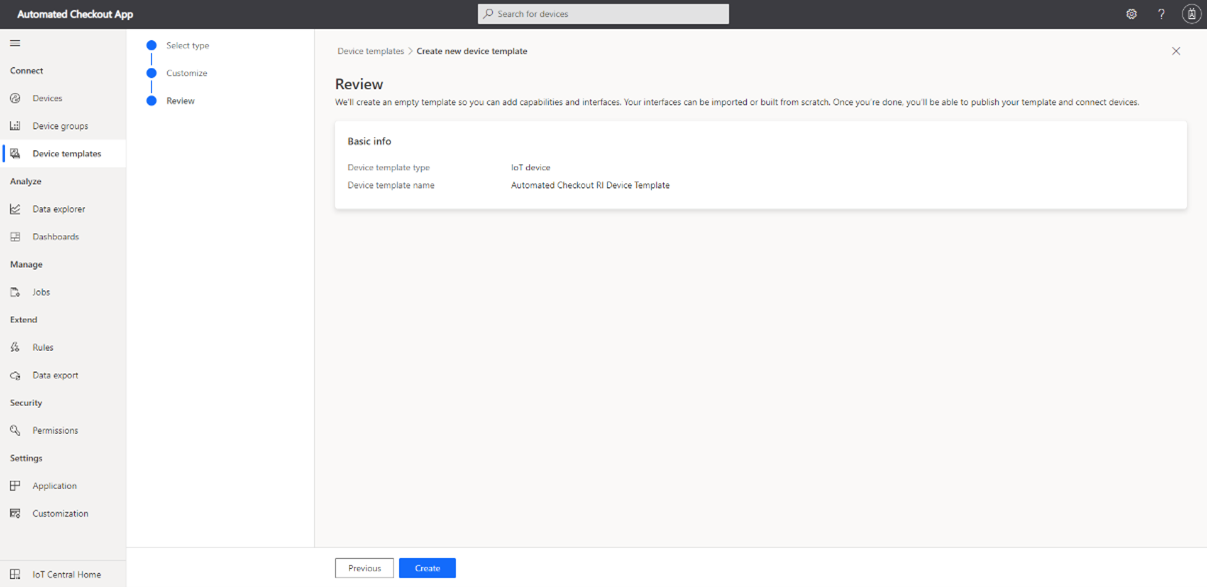
- Click on Import a model and upload the capability model AC_DCM.json.
The typical path is: ~/Desktop/Connect_Edge_Devices_to_Azure_IoT/AC_Azure_IoT/
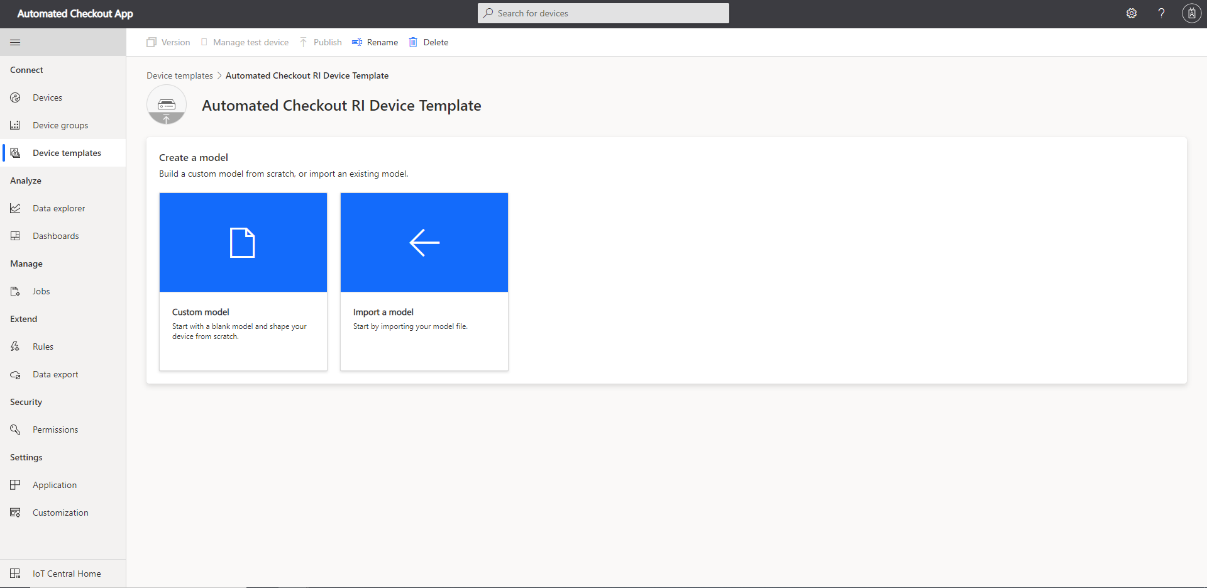
Upload the capability model:
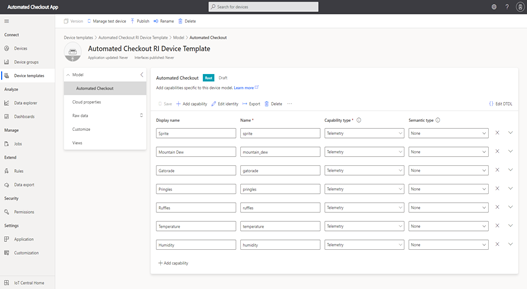
- To create an overall view, click Views and choose Visualizing the Device. Provide a View Name, for example, View-Overall and add the following tiles to the view. Click on Start with devices and choose telemetry names from the drop-down.
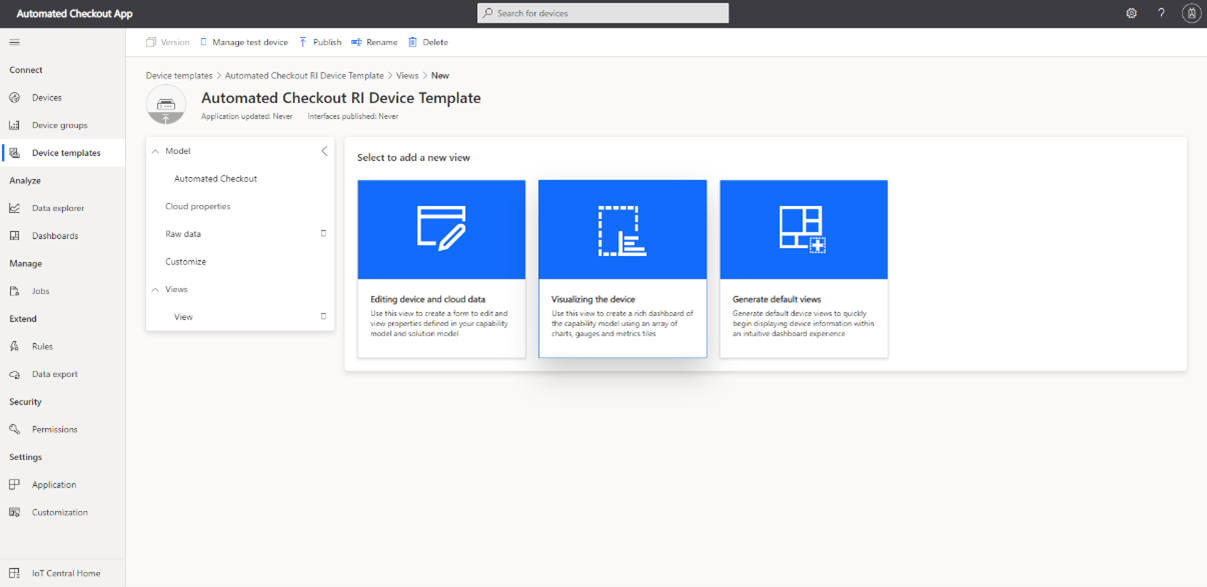
SI No. Title Name Telemetry Name Visualizing Panel Size 1 <Leave this field empty> <Leave this field empty> Markdown^ 1x3 2 Temperature (°F) Temperature Last Known Value* 1x1 3 Humidity Humidity Last Known Value* 1x1 4 Sprite Sprite / Units Last Known Value** 1x1 5 Inventory Sprite / Units,
Mountain Dew / Units,
Gatorade / Units,
Pringles / Units,
Ruffles / UnitsLine Chart 4x2 6 Mountain Dew Mountain Dew / Units Last Known Value** 1x1 7 Gatorade Gatorade / Units Last Known Value** 1x1 8 Pringles Pringle / Units Last Known Value** 1x1 9 Ruffles Ruffles / Units Last Known Value** 1x1
NOTE: The symbols (^, * and **) in the Visualizing Panel column represent a specific action to be done. Refer to the below table for details.
SI. No Symbol Property Value 1 ^ Description <br><br><br><br><br><br><br><br><br><br><center><h1> # Vending Machine 1 ➤</center> 2 * and ** Text Size 44 3 ** Decimals 0
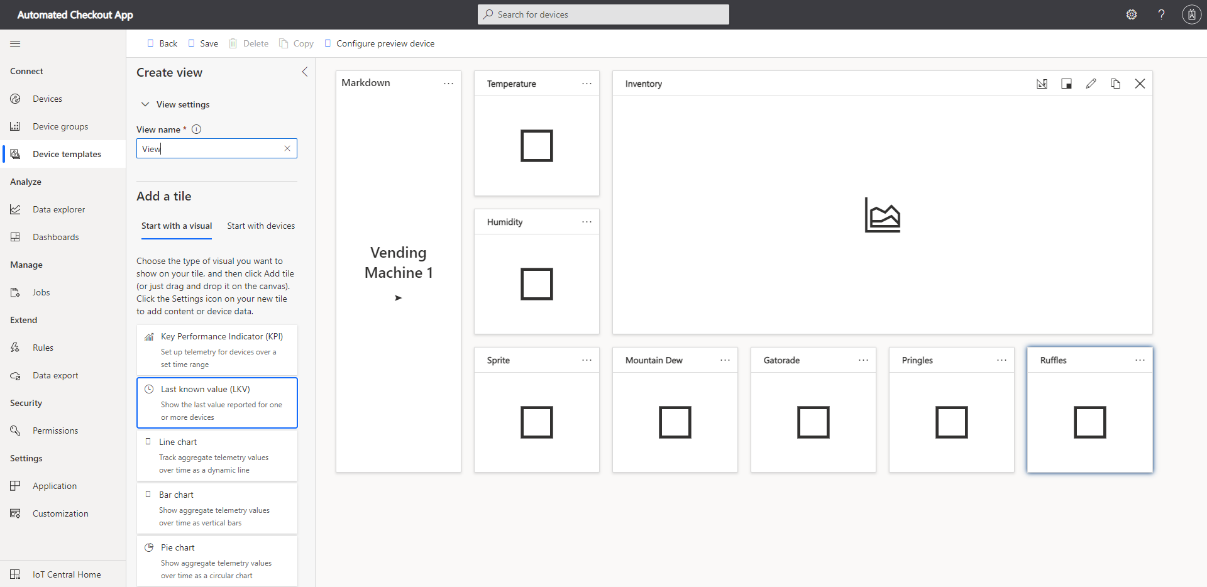
- To create a channel-wise view, click Views and choose Visualizing the Device. Provide a View Name, for example, Inventory, and add the following tiles to the view.
Click on Start with devices and choose telemetry names from the drop-down.
SI No. Title Name Telemetry Name Visualizing Panel Size 1 Sprite Sprite / Name Last Known Value 2x1 2 Mountain Dew Mountain Dew / Name Last Known Value 2x1 3 Gatorade Gatorade / Name Last Known Value 2x1 4 Pringles Pringle / Name Last Known Value 2x1 5 Ruffles Ruffles / Name Last Known Value 2x1 6 Price Sprite / Price Last Known Value 1x1 7 Price Mountain Dew / Price Last Known Value 1x1 8 Price Gatorate / Price Last Known Value 1x1 9 Price Pringles / Price Last Known Value 1x1 10 Price Ruffles / Price Last Known Value 1x1 11 Units Sprite / Units Last Known Value 1x1 12 Units Mountain Dew / Units Last Known Value 1x1 13 Units Gatorate / Units Last Known Value 1x1 14 Units Pringles / Units Last Known Value 1x1 15 Units Ruffles / Units Last Known Value 1x1 16 Maximum Stock Sprite / Maximum Stock Last Known Value 1x1 17 Maximum Stock Mountain Dew / Maximum Stock Last Known Value 1x1 18 Maximum Stock Gatorade / Maximum Stock Last Known Value 1x1 19 Maximum Stock Pringles / Maximum Stock Last Known Value 1x1 20 Maximum Stock Ruffles / Maximum Stock Last Known Value 1x1
The view will be similar to:
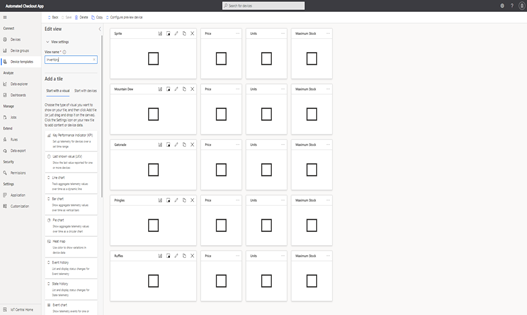
-
Click Publish on the top panel. When prompted, click the Publish button to publish your device template.
Step 3: Add Device to Device Template
In the next series of steps, you will attach an edge device to your published Automated Checkout device template.
- In your Azure IoT Central application, navigate to the Devices page and choose the template you created in the previous step.
- Click on + New to add the new device to the template.
- Provide the required details and click Create (refer to the screenshot below).
- Make sure you choose the right device template from the drop-down box.
- Give a display name to your device.
- Provide a device ID.
- Do not enable the Simulate this device option.
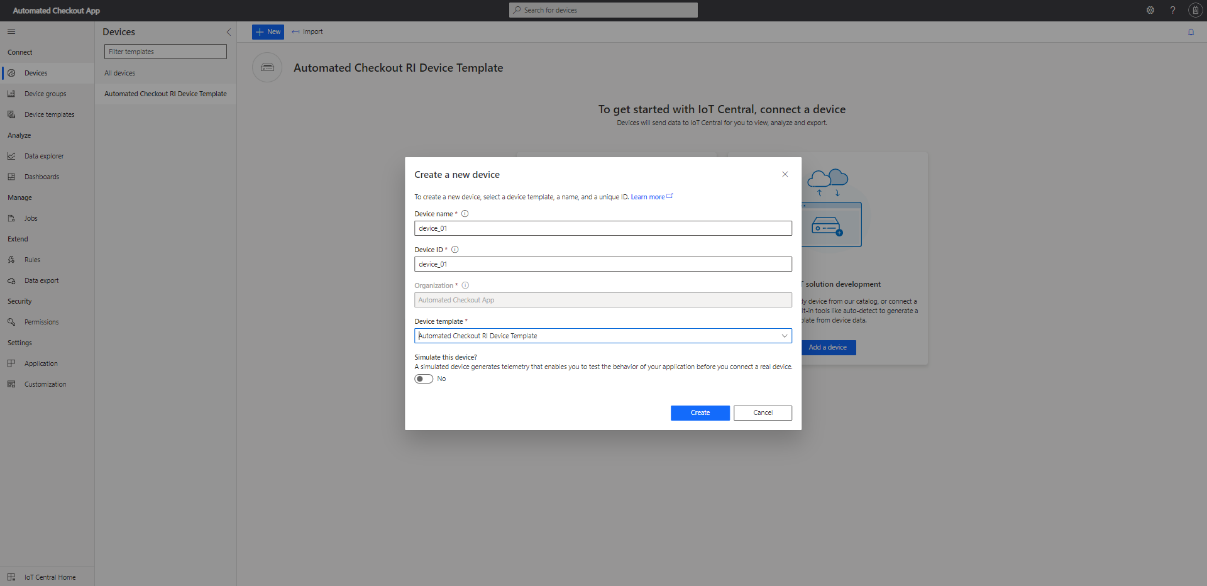
Step 4: Get Device Connection Parameters
In the next series of steps, you will view device connection parameters of the Azure IoT Central device.
- On the Device page, select the device you created in the previous step.
- Select Connect.
- Make a note of the ID Scope, Device ID, and Primary Key values.
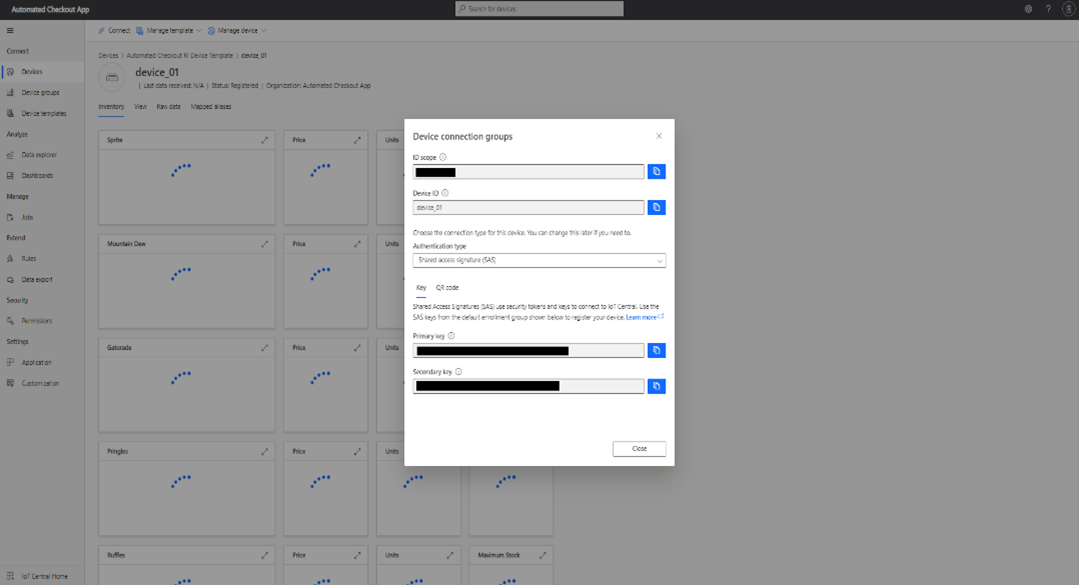
Step 5: Run Program to Connect to Azure Dashboard
This section describes how to run a program that fetches data from the Automated Checkout using Rest API and sends the data to the Azure IoT Central dashboard. There are different steps for Linux and for EFLOW.
Step 5.1: Run Program on Linux
- Go to the AC_Azure_IoT directory:
cd ~/Desktop/Connect_Edge_Devices_to_Azure_IoT/AC_Azure_IoT/ - Enter the command below using the parameters from the previous step.
chmod +x connect.sh
./connect.sh -a IOT_Central -s <ID SCOPE> -d <DEVICE ID> -k <PRIMARY KEY> -p <HOST IP> -i <INTERVAL>
You will see output similar to:
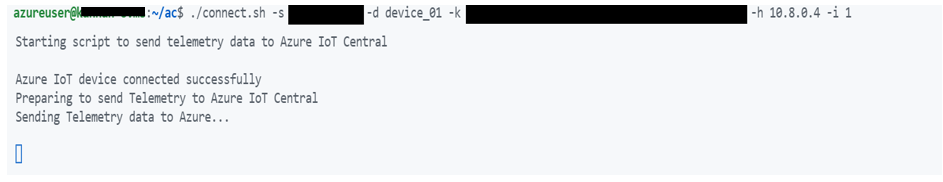
NOTE: Use device Scope ID, Device ID and Primary Key obtained from the previous step in the Visualization in Azure IoT Central section.
You can run the reference implementation in parallel to send live data.
The HOST IP is the IP of the machine on which RI is running.
You can adjust the metric sending interval with INTERVAL.
Step 5.2: Run Program on EFLOW
- Go to the connect_aziot module in IoT hub that was created in the previous section.
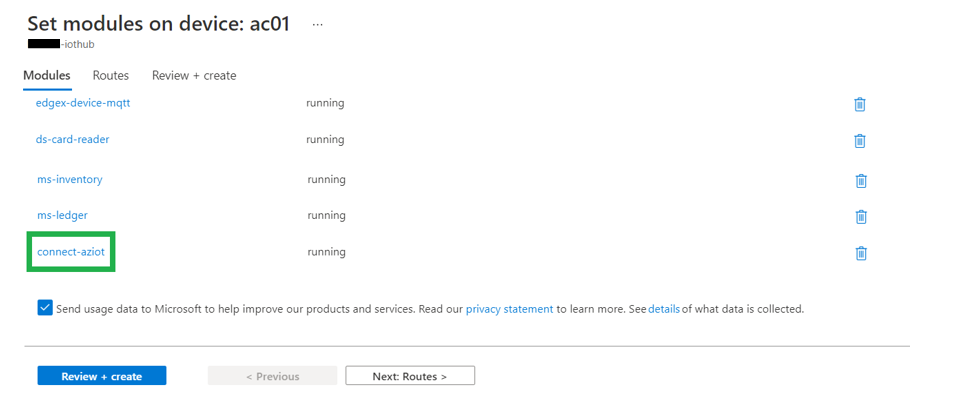
-
Add the following configuration to the Container Create Options for the IoT Edge Module.
-
Update the variables mentioned in the below json with values noted in the Get Device Connection Parameters step.
For example, the value <SCOPE ID> should be updated with the scope ID of the Azure IoT Central device.
{
      "NetworkingConfig": {
        "EndpointsConfig": {
            "host": {}
        }
    },
    "HostConfig": {
        "NetworkMode": "host"
    },
    "Cmd": [
        "python3",           "Connect_Edge_Devices_to_Azure_IoT/AC_Azure_IoT/send_telemetry.py",
        "-az",
        "IOT_Central",
        "-s",
        "<SCOPE ID>",
        "-d",
        "<DEVICE ID>",
        "-k",
        "<PRIMARY KEY>",
        "-ip",
        "localhost",
        "-i",
        "<INTERVAL>"

    ]
}
-
Once updated, copy the updated content to Container Create Options section of the module.
-
-
After updating the above details, it should look similar to the following:
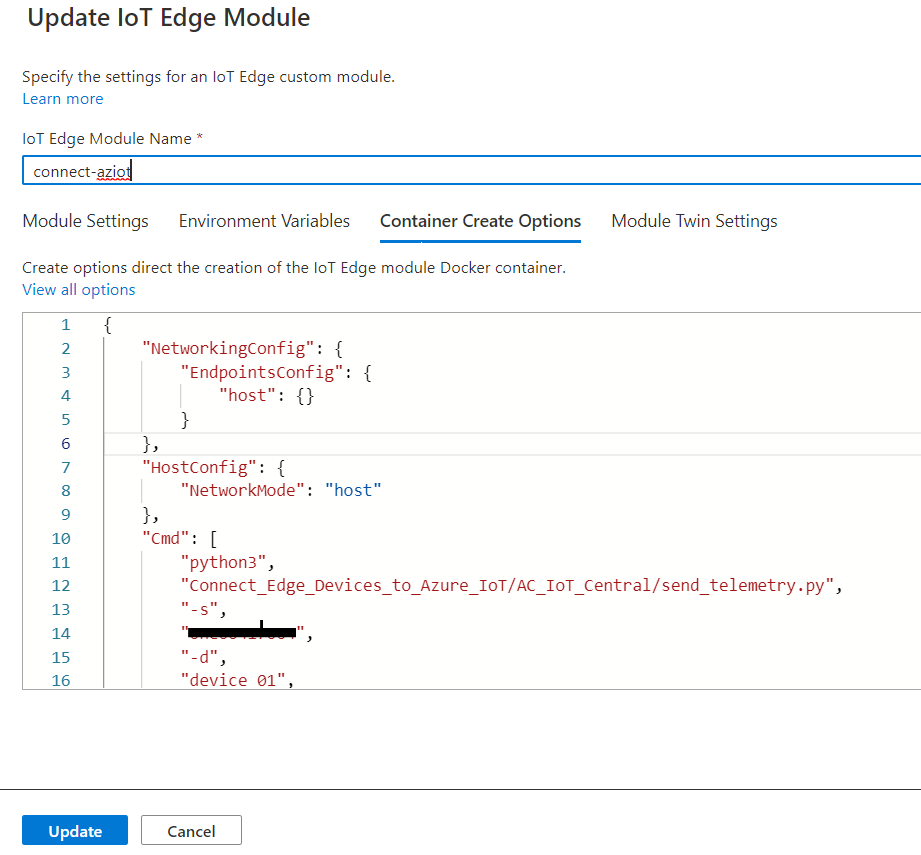
-
After adding all the required modules, click on Review + Create to proceed to the validation page.
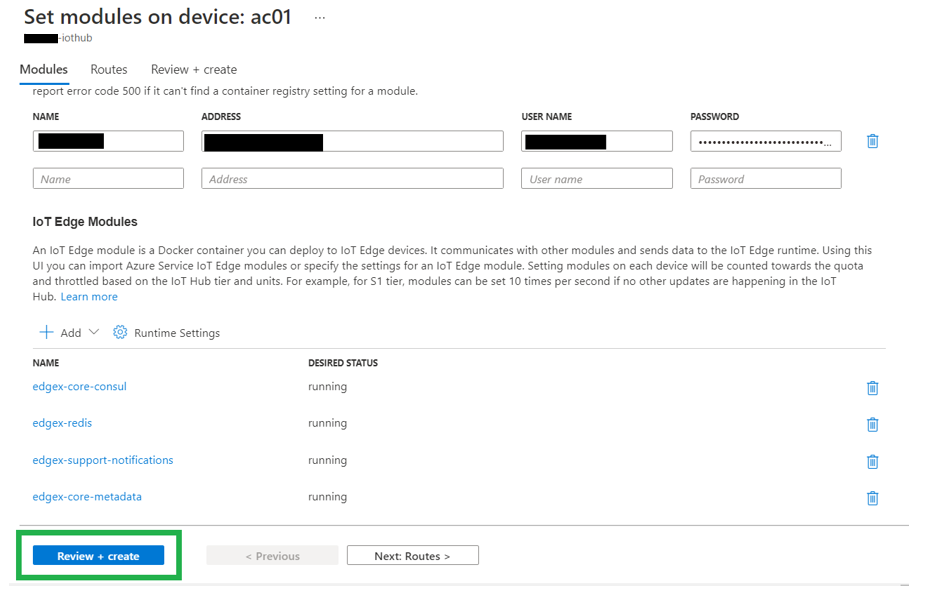
-
Once validation is done, click on Create to deploy the modules in EFLOW.
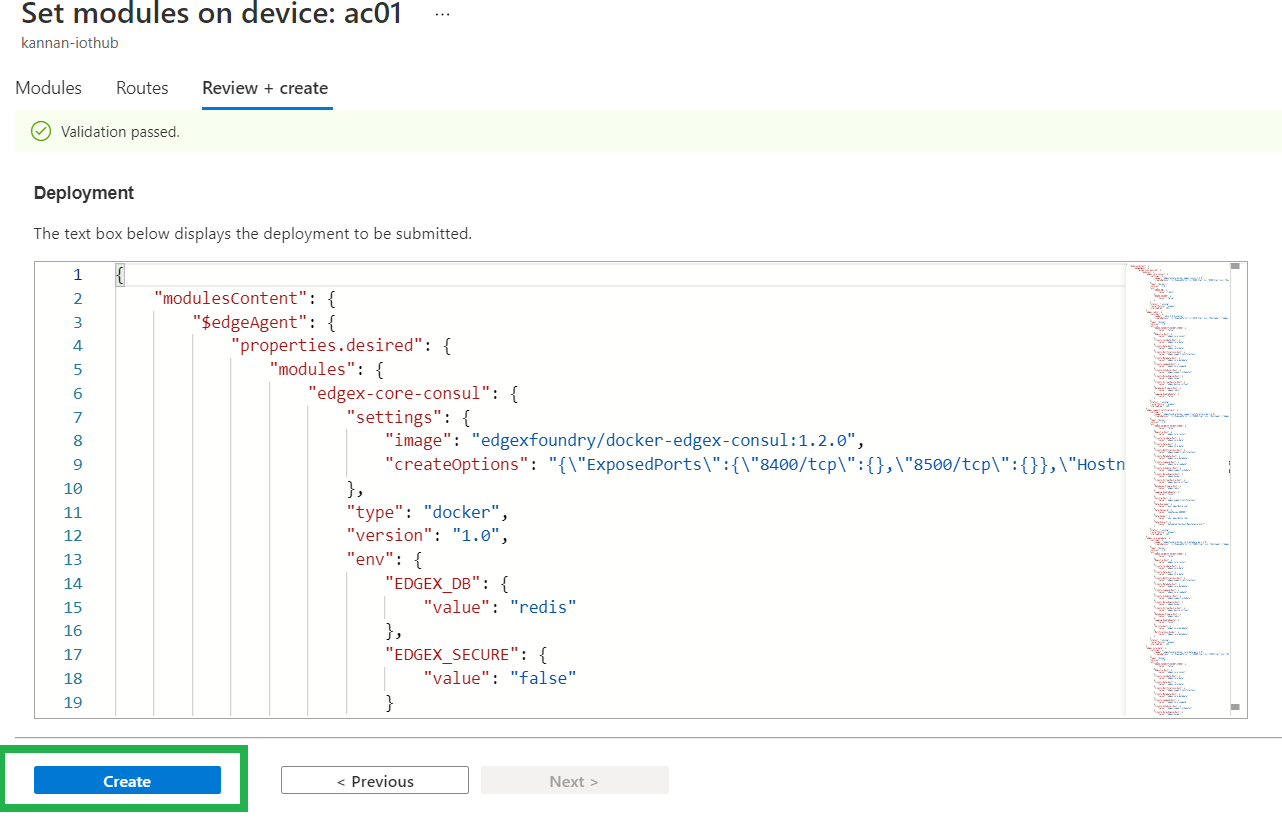
Step 6: Simulating Automated Checkout RI Scenarios
This section describes how to simulate the following retail cooler scenarios:
- An employee stocks the cooler
- The cooler is empty - it has no stock in its inventory
- A worker swipes their badge
- The worker adds stock to the cooler
- A customer purchases an item
- Later, a customer swipes their badge to open the cooler
- The customer takes item(s) from the inventory
- The customer closes the door and gets billed
- The cooler requires maintenance
- The internal temperature of the cooler has exceeded the maximum temperature threshold
- A maintenance worker resolves the issue
The next sections describe two different ways of simulating these scenarios.
Step 6.1: Simulating using curl REST API calls
The steps in the Simulate User Actions section in the Automated Checkout RI user guide show how to simulate the automated checkout workflow using curl REST API calls. It is a step-by-step walkthrough with specific commands to run on the command line.
Step 6.2: Simulating using automated script
The automated checkout workflow scenarios can be simulated automatically using a simulator script that utilizes the Python requests library to make REST API requests. This script helps simulate all the scenarios mentioned above and avoids manual step-by-step execution of REST API using the command line.
You need the following prerequisites to run the simulator script:
- python3
In case of deploying in EFLOW, copy the repo to the Windows host machine.
The simulator script will follow the below flow to simulate the scenarios:
- Employee stocks the cooler
- Customer purchasing from the cooler. The script will continue this scenario four times until the cooler is empty.
- The cooler requires maintenance.
Follow the below steps to run the simulator script.
- Go to the AC_Azure_IoT directory:
cd ~/AC_Azure_IoT/
-
Run the command below with the host_ip parameter:
python3 simulator.py --host_ip/-ip <HOST IP>
NOTE: The HOST IP is the IP of the machine on which Automated Checkout RI is running (EFLOW VM IP for EFLOW based deployment). Default value is 127.0.0.1.
You will see output similar to:
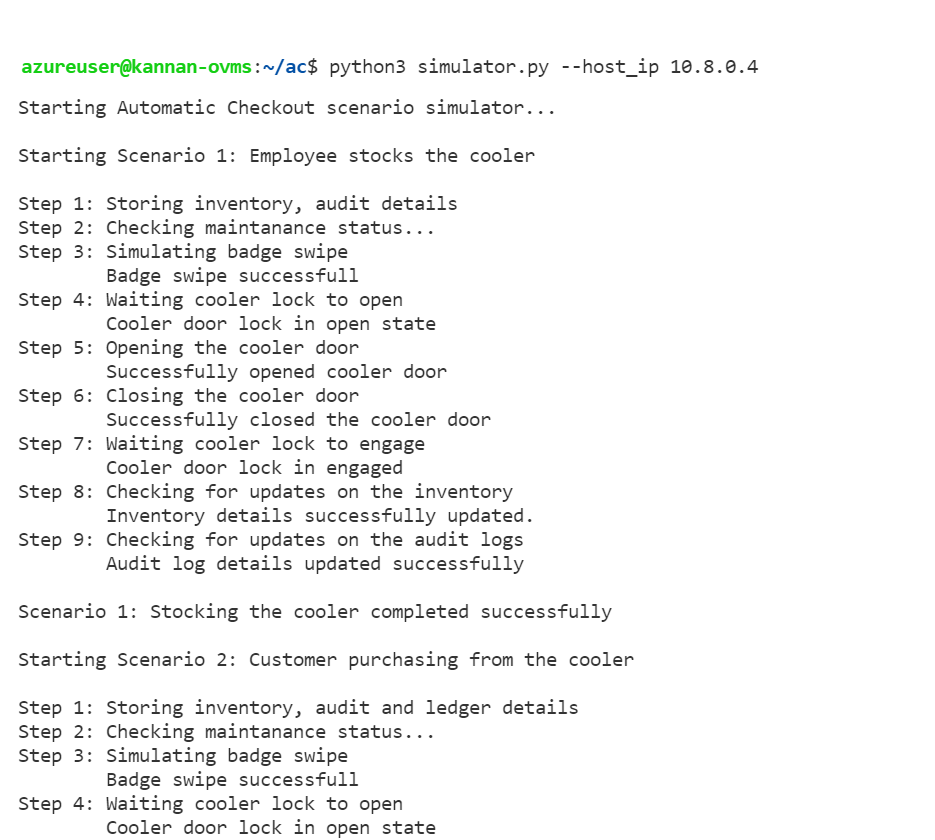
Step 7: Monitor Data in Azure IoT Central Dashboard
In the following series of steps, you will monitor data exported to your Azure IoT Central dashboard.
- Go to your Azure IoT Central dashboard.
- Navigate to Devices and choose the device template you created for Automated Checkout.
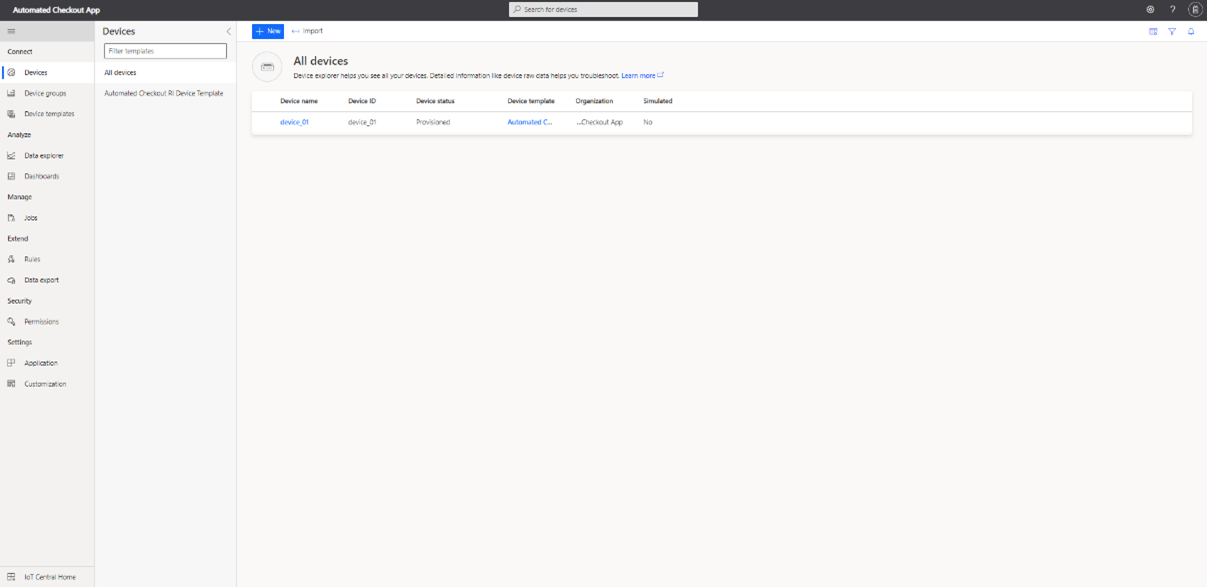
- Click your device, then click on different tabs to display telemetry data in the dashboard as shown below.
- Admin View
This view provides current cooler parameters and high-level insights on inventory using historical data.
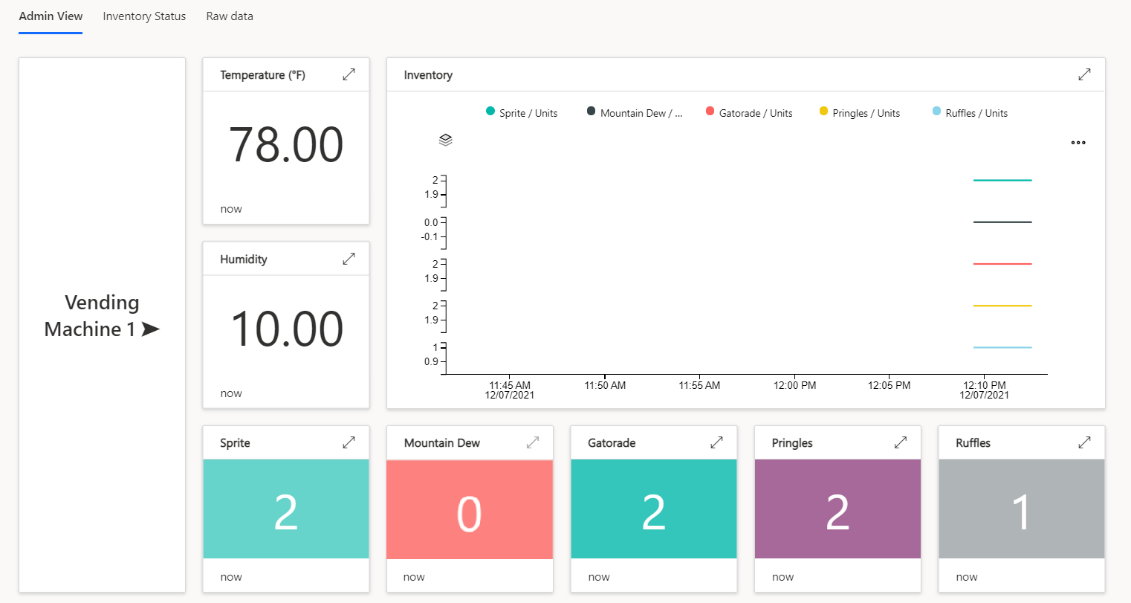
- Inventory Status
This view provides real-time status of each product on the inventory.
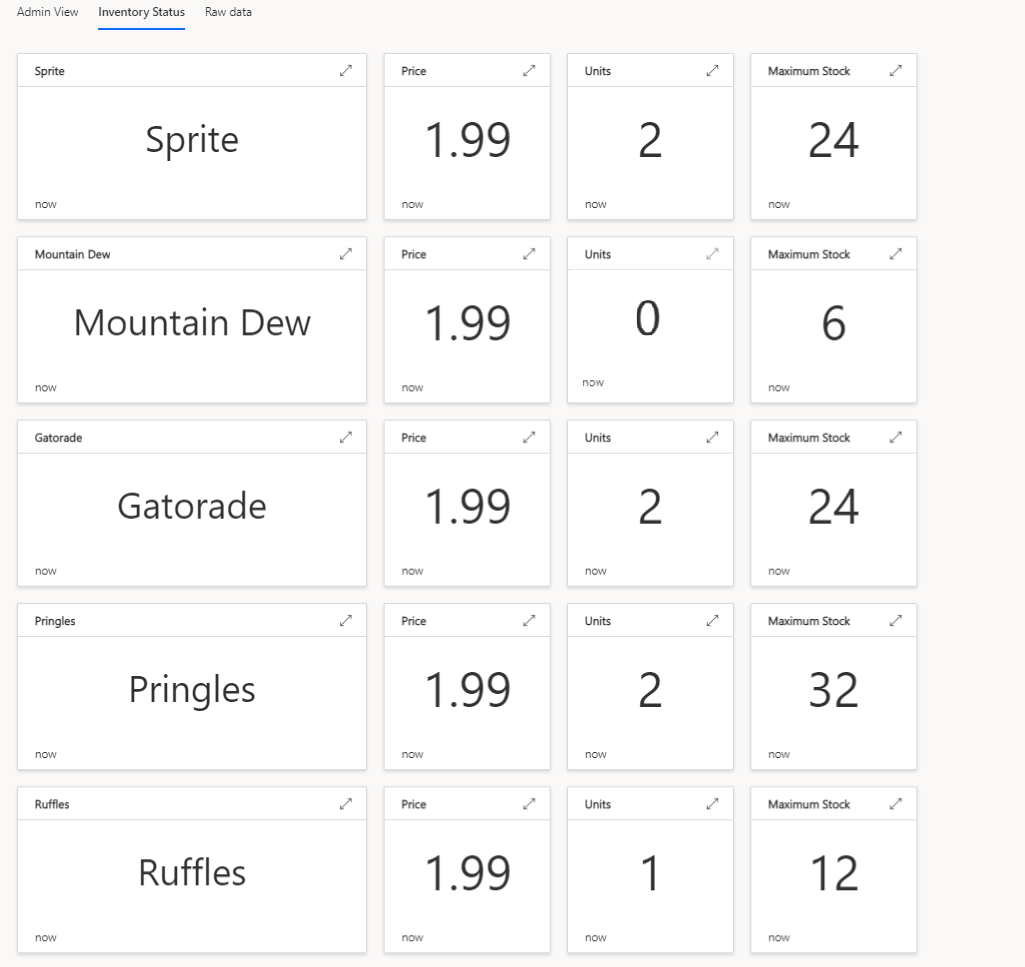
- Admin View
To learn more, you can add Out-of-Band Manageability functionality to your reference implementation.
Intelligent Traffic Management Reference Implementation
In this section, you will create an Azure IoT Central dashboard for the Intelligent Traffic Management reference implementation, run standalone Python code to fetch telemetry data from InfluxDB, and send data to the Azure IoT Central dashboard for visualizing telemetry data. You can utilize the rest of the Azure IoT Central services to meet your needs. You will be able to run this application in both the Ubuntu* Linux* and Azure IoT Edge for Linux on Windows* (EFLOW) environments.
Prerequisites
Before you continue, you must complete the following:
- If you have not done so already, install Connect Edge Device to Azure* IoT (See Step 5: Install the connect_devices_to_azure_iot in the Getting Started section above).
NOTE: You are not required to run the web app or any additional steps for the installation (i.e., you are just installing to access the scripts).
- Complete the steps to install and run the Intelligent Traffic Management reference implementation.
NOTE: These steps will result in building containers for the Linux environment. To build containers for the EFLOW environment, refer to the Deployment in Windows Environment section.
Deployment in Linux Environment
Visualization in Grafana
To view the inference results in your local Grafana dashboard, follow the Visualize the Map UI on Grafana instructions in the Intelligent Traffic Management Reference Implementation.
Visualization in Azure IoT Central
To view the inference results in the IoT Central dashboard, follow the Visualization in Azure IoT Central instructions later in this guide.
Deployment in Windows EFLOW Environment
Azure IoT Edge for Linux on Windows (EFLOW) works by running a Linux virtual machine on a Windows device. The Linux virtual machine comes pre-installed with the IoT Edge runtime. Any IoT Edge modules deployed to the device runs inside the virtual machine. Meanwhile, Windows applications running on the Windows host device can communicate with the modules running in the Linux virtual machine.
EFLOW enables users to run production Linux-based cloud-native workloads on Windows IoT device, while providing only server mode access to VM and no GUI support.
Prerequisites
- If you have not done so already, install Connect Edge Device to Azure* IoT (See Step 5: Install the connect_devices_to_azure_iot in the Getting Started section above).
- Complete the steps to install and run the Intelligent Traffic Management reference implementation.
- If all the required containers are already available in Azure Container Registry (ACR) or any other container registry, go directly to the Set Up Azure Resources for Deployment section. If not, build and push the containers by following the steps below.
Build Intelligent Traffic Management Docker Images
Since container images are not readily available for Intelligent Traffic management, this section will provide details to create and upload the container images to Azure Container Registry. To make the Intelligent Traffic Management reference implementation’s containers work with Microsoft EFLOW, modify Docker file for Smart City container and build new Docker image as described below.
1. Go to the reference implementation installation folder by executing the command:
cd Intelligent_Traffic_Management_<version>/Intelligent_Traffic_Management/intelligent-traffic-management
2. Open Dockerfile in text editor and make these changes:
- Add instructions to copy resource folder and camera_config.json file:
COPY resources /resources COPY camera_config.json /camera_config.json - Pass the value of Grafana port argument (g_port) as 3000:
-g_port 3000
After adding instructions, it should look similar to the following:
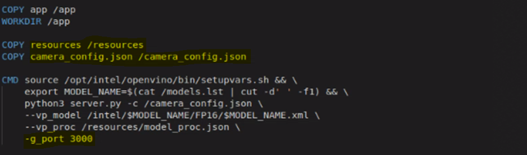
3. To build the Docker images for Intelligent Traffic Management containers, run the command:
sudo -E docker-compose build
Push Intelligent Traffic Management Docker Images to ACR
Follow the steps below to push Intelligent Traffic Management Docker images to ACR.
1. To create an Azure Container Registry (ACR), use the following link: Creating a container registry.
2. Go to Azure portal > container registry > choose your container registry > Access keys
Enable Admin user, get the details of container registry and please make a note of username, password, and login server for further steps.
3. Login to your Azure container registry:
sudo docker login -u <ACR username> -p <ACR password> <ACR login server>
4. Tag all Intelligent Traffic Management Docker images:
sudo docker tag intelligent-traffic-management_smartcity:latest <ACR login server>/intelligent-traffic-management_smartcity:latest
sudo docker tag intelligent-traffic-management_grafana:latest <ACR login server>/intelligent-traffic-management_grafana:latest
5. Push all Intelligent Traffic Management Docker images to ACR:
sudo docker push <ACR login server>/intelligent-traffic-management_smartcity:latest
sudo docker push <ACR login server>/intelligent-traffic-management_grafana:latest
If you have not done so already, install Connect Edge Devices to Azure* IoT (See Step 5: Install the connect_devices_to_azure_iot).
Build Connect Edge Devices to Azure IoT Docker Images
To make the Connect Edge Devices to Azure IoT work with Azure EFLOW, build it as container.
1. Go to Connect_Edge_Devices_to_Azure_IoT folder in Desktop:
cd ~/Desktop/Connect_Edge_Devices_to_Azure_IoT
2. Build Docker image:
sudo docker build . -t connect-edge-devices-to-azure-iot:latest
Push Connect Edge Devices to Azure IoT Docker Images to ACR
Follow the steps below to push Connect Edge Devices to Azure IoT docker images to ACR.
1. Tag Connect Edge devices to Azure IoT container:
sudo docker tag connect-edge-devices-to-azure-iot:latest <ACR login server>/connect-edge-devices-to-azure-iot:latest
2. Push the container to ACR:
sudo docker push <ACR login server>/connect-edge-devices-to-azure-iot:latest
Set Up Azure Resources for Deployment
Before deploying the Intelligent Traffic Management Reference Implementation and Connect Edge devices to Azure IoT modules on EFLOW, you must complete the following steps.
Create Azure IoT Hub
1. Follow the Create an IoT hub using the Azure portal instructions.
2. In your Azure Portal, go to your IoT Hub.
3. Under Automatic Device Management from the menu on the left, select IoT Edge.
4. Click on Add IoT Edge Device to create a new edge device for EFLOW VM. Provide a device ID and click the Save button.
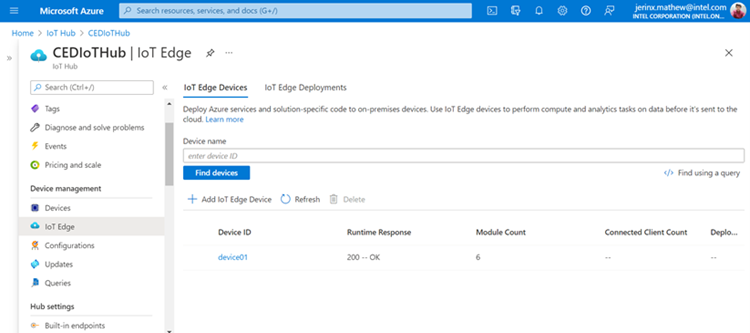
5. Select the device ID of the target device you just created. Make a note of primary connection string for future reference.
Create Microsoft EFLOW device
To create an EFLOW device, follow the Microsoft installation guide.
During the provisioning step, choose manual provisioning and provide the connection string of your IoT hub.
Deploy Reference solution in EFLOW
For deploying IoT modules which are pushed into ACR, follow the steps below.
1. Go to IoT device that is created in IoT hub in previous step, select the Module Settings tab.
2. On the container registry credential, provide the details of your Azure Container Registry that you have created in previous section. The username, password, and login server address can be found in your registry, under Settings in the Access keys section.
3. On the IoT Edge Modules, choose Add and select to add an IoT Edge Module. We need to add all the ITM containers as IoT edge Module to IoT Edge Deployment to EFLOW VM.
The edge modules listed below are added by referencing to ITM RIs docker compose file along with Connect Edge devices to Azure IoT.
| Container | Edge Module Name | Startup Order | Image URI |
| Influx DB | itm_influxdb | 1 | influxdb:1.7 |
| Grafana | itm_grafana | 2 | As per docker image URI in AZCR |
| Smart City | itm_smartcity | 3 | As per docker image URI in AZCR |
| Connect Edge Devices to Azure IoT | connect_edge_devices_to_azure_iot | 4 | As per docker image URI in AZCR |
The dialog will look similar to:
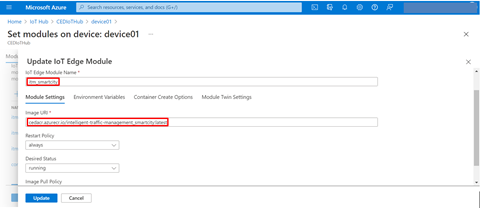
4. The Smart City and Grafana modules will need to have some more information under the Environment Variables and Container Create Options tabs:
- The Smart City container has several environment variables that need to be added for the container to run in the EFLOW environment.
Environment Variable Value HOST_IP <EFLOW VM IP> GRAFANA_HOST itm_grafana INFLUXDB_HOST itm_influxdb LOCAL_HOST 0.0.0.0
NOTE: In EFLOW environment (after creating EFLOW VM), use Windows PowerShell to execute the command below to get the EFLOW VM IP address:Get-EflowVMAddr
After updating the environment variables in IoT Edge Module, the screen will look similar to:
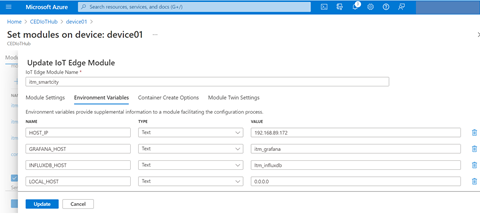
-
The Smart City and Grafana containers will both have port bindings and volume mount that need to be accessed by container (information in the docker-compose.yml file) as shown below:
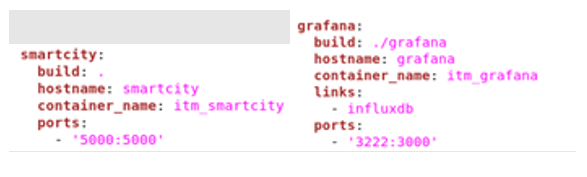
Update these settings as per the docker-compose.yml file under the Container Create Options.
Refer to the code snippets and screenshots below for details.
itm_smartcity Container Create Options{ "HostConfig": { "Devices": [ { "PathOnHost": "/dev/", "PathInContainer": "/dev/", "CgroupPermissions": "rwm" } ], "NetworkHost": "host", "PortBindings": { "5000/tcp": [ { "HostPort": "5000" } ] }, "Binds": [ "/dev:/dev", "/var/tmp:/var/tmp" ] } }
After updating the above details, it should look similar to:
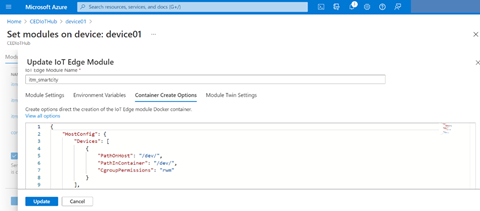
itm_grafana Container Create Options{ "HostConfig": { "PortBindings": { "3000/tcp": [ { "HostPort": "3222" } ] } } }After updating the above details, it should look similar to:
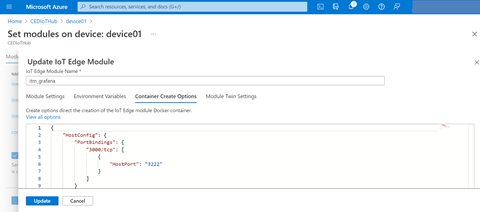
5. Once validation is done, click on Create to deploy the modules in EFLOW.
Monitoring Edge Device
Using Windows Admin Center
After successful setup/deployment of EFLOW, you can connect to your EFLOW VM from Windows Admin Center and see the status of your edge modules as shown below:
NOTE: Make a note of the IP address for viewing Grafana Dashboard.
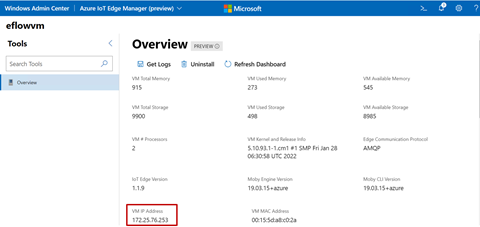
Using Windows PowerShell
- Connect to your EFLOW VM from windows machine by executing this command in PowerShell:
Connect-EflowVM -
Run the below command to see the deployed list of edge modules:
sudo iotedge list
You should see output similar to:
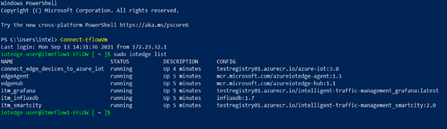
-
To check the logs of edge modules, execute the command:
sudo iotedge logs <edge module name>
Visualization in Grafana
To view the inference results in your local Grafana dashboard, open a browser on the Windows machine that hosts the EFLOW VM and navigate to: <EFLOW VM IP address>:3222
- Log in with User as admin and password as admin.
- Click on Home and select ITM to open the main dashboard.
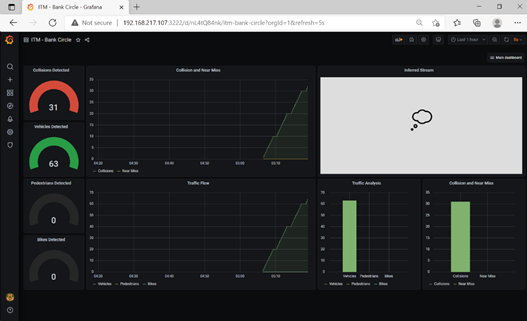
Visualization in Azure IoT Central
This section contains instructions for both Linux and EFLOW.
Step 1: Create Azure IoT Central Dashboard
To create an Azure IoT Central dashboard, follow these instructions.
Step 2: Create Device Template
To create a device template, follow these steps:
1. Go to the Azure IoT Central application that you created in step 1, then navigate to Device templates and choose +New.
2. On the Select template type page, choose the IoT Device tile. Then select Next: Customize.
3. On the Customize page, provide a name for the device template and select Next: Review.
NOTE: You do not need to select the check box for Gateway device with downstream devices. 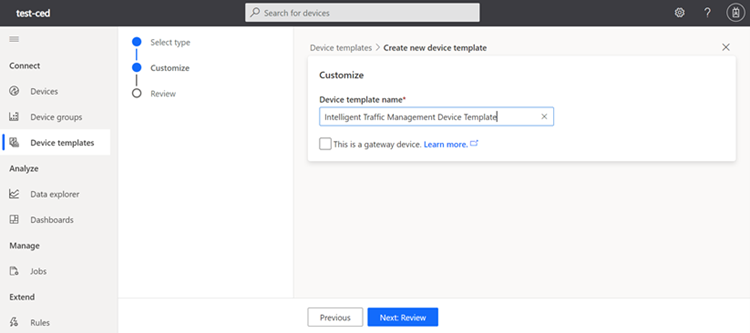
4. On the Review page, select Create.
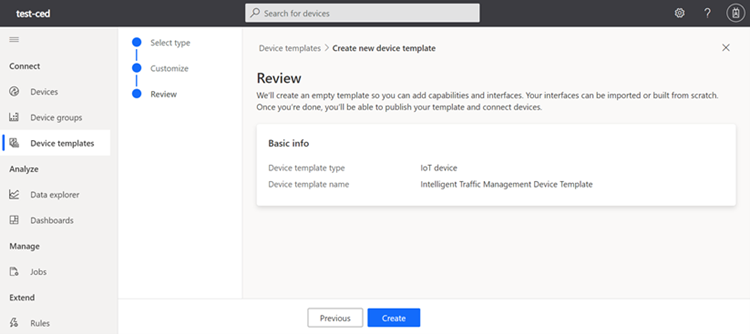
5. Click on Import a model and upload the capability model ITM_DCM.json.
The typical path is: ~/Desktop/Connect_Edge_Devices_to_Azure_IoT/ITM_Azure_IoT/
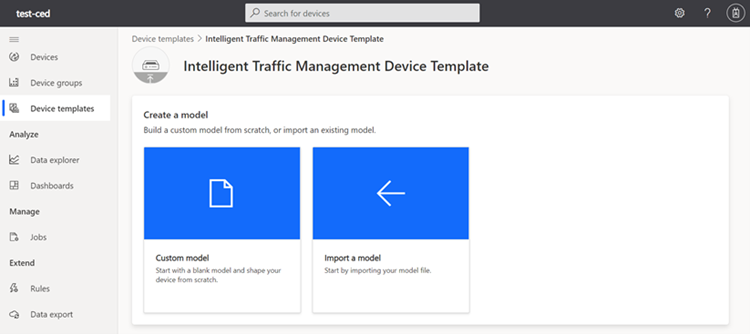
6. To create an overall view, click Views and choose Visualizing the Device. Provide a View Name, for example, View-Overall and add the following tiles to the view:
| SI No. | Title Name | Telemetry Name | Visualizing Panel | Size |
|---|---|---|---|---|
| 1 | Total Vehicle Count | Total Car Count | Last Known Value* | 2x1 |
| 2 | Total Bicycle Count | Total Bicycle Count | Last Known Value* | 2x1 |
| 3 | Total People Count | Total People Count | Last Known Value* | 2x1 |
| 4 | Total Collision Count | Total Collision Count | Last Known Value* | 2x2 |
| 5 | Traffic Analysis | Total Car Count |
Pie Chart | 2x2 |
| 6 | Total Collision Chart | Total Collision Count | Line Chart** | 2x2 |
| 7 | Traffic Flow | Total Car Count |
Line Chart** | 2x2 |
* Disable the ‘Abbreviate values’ option in configure options.
** Select Display Range as ‘last 100 value’ in chart configure options.
The view will be similar to:
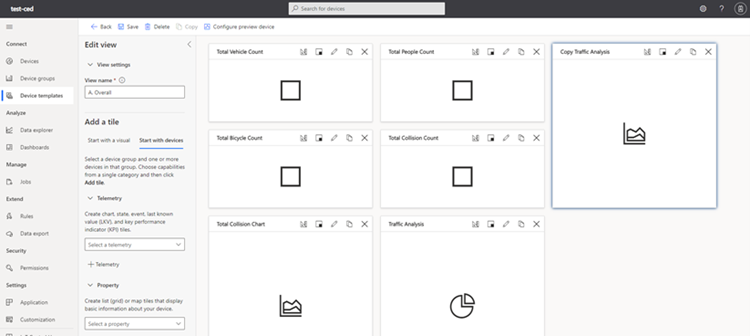
7. To create a channel-wise view, click Views and choose Visualizing the Device. Provide a View Name, for example, View-ChannelWise and add the following tiles to the view:
| SI No. | Title Name | Telemetry Name | Visualizing Panel | Size |
|---|---|---|---|---|
| 1 | Channel 0 | Channel 0 / Bicycle Count |
Pie Chart | 2x2 |
| 2 | Channel 1 | Channel 1 / Bicycle Count |
Pie Chart | 2x2 |
| 3 | Channel 2 | Channel 2 / Bicycle Count |
Pie Chart | 2x2 |
| 4 | Channel 3 | Channel 3 / Bicycle Count |
Pie Chart | 2x2 |
| 5 | Channel 4 | Channel 4 / Bicycle Count |
Pie Chart | 3x2 |
| 6 | Channel 5 | Channel 5 / Bicycle Count |
Pie Chart | 3x2 |
| 7 | Channel 6 | Channel 6 / Bicycle Count |
Pie Chart | 3x2 |
| 8 | Channel 7 | Channel 7 / Bicycle Count |
Pie Chart | 3x2 |
| 9 | Channel 8 | Channel 8 / Bicycle Count |
Pie Chart | 2x2 |
The view will be similar to:
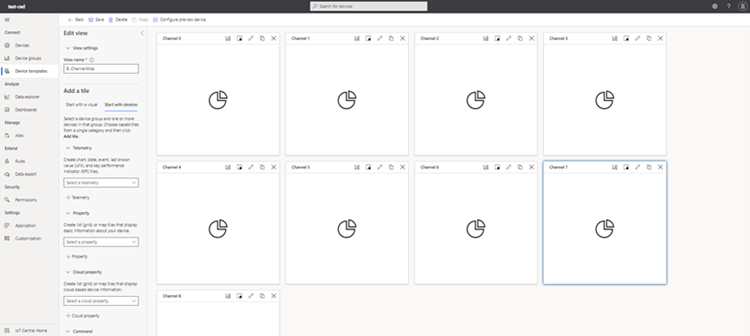
8. To create a channel wise view, click on ‘Views’ and choose ‘Visualizing the Device’. Provide a View Name, for example ‘C. Collision View’ and add following tiles to the view:
| I No. |
Title Name |
Telemetry Name |
Visualizing Panel |
Size |
|---|---|---|---|---|
| 1 |
Channel 0 |
Collision – Channel 0, |
Bar Chart |
2x2 |
| 2 |
Channel 2 |
Collision – Channel 2, |
Bar Chart |
2x2 |
| 3 |
Channel 6 |
Collision – Channel 6, |
Bar Chart |
2x2 |
| 4 |
Channel 7 |
Collision – Channel 7, |
Bar Chart |
2x2 |
| 5 |
Collision Event |
Collision Event |
Last Known Value |
3x2 |
| 6 |
near Miss |
Near Miss – Channel 0, |
KPI |
3x2 |
| 7 |
Collision Chart |
Collision – Channel 0, |
Line Chart** |
3x2 |
** Select Display Range as ‘last 100 value’ in chart configure options.
The view will be similar to:
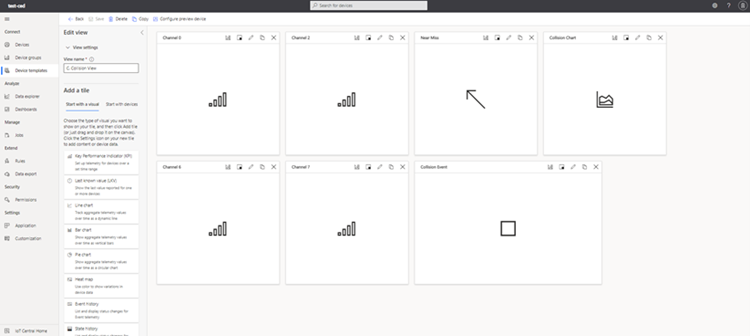
9. Click on ‘publish’ on top panel when prompted. Click on the ‘publish’ button to publish your device template.
Step 3: Add Device to Device Template
- In your Azure IoT Central application, navigate to the Devices page and choose the template you created in the previous step.
- Click on + New to add the new device to the template.
- Provide the required details and click Create (refer to the screenshot below).
- Make sure you choose the right device template from the drop-down box.
- Give a display name to your device.
- Provide a device ID.
- Do not enable the Simulate this device option.
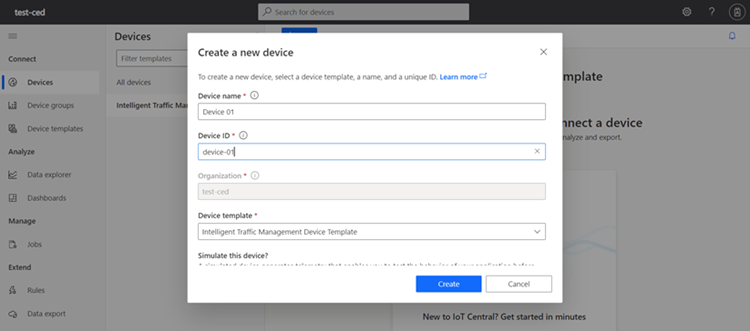
Step 4: Get Device Connection Parameters
View and record the device connection parameters of the Azure IoT Central device.
- On the Device page, select the device you created in the previous step.
- Select Connect.
- Make a note of the ID Scope, Device ID, and Primary Key values.
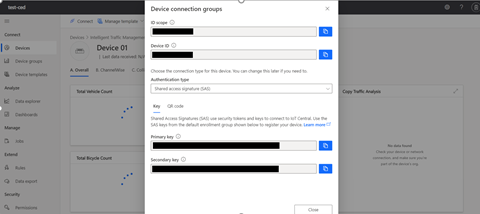
Step 5: Run Program to Connect to Azure Dashboard
This section describes how to run a program that fetches data from the InfluxDB and sends the data to the Azure IoT Central dashboard. There are different steps for Linux and for EFLOW.
Step 5.1 Run Program on Linux
1. Go to the ITM_Azure_IoT directory:
cd ~/Desktop/Connect_Edge_Devices_to_Azure_IoT/ITM_Azure_IoT/
2. Enter the command below using the parameters from the previous step.
chmod +x connect.sh
./connect.sh -s <ID SCOPE> -d <DEVICE ID> -k <PRIMARY KEY>
You will see output similar to:
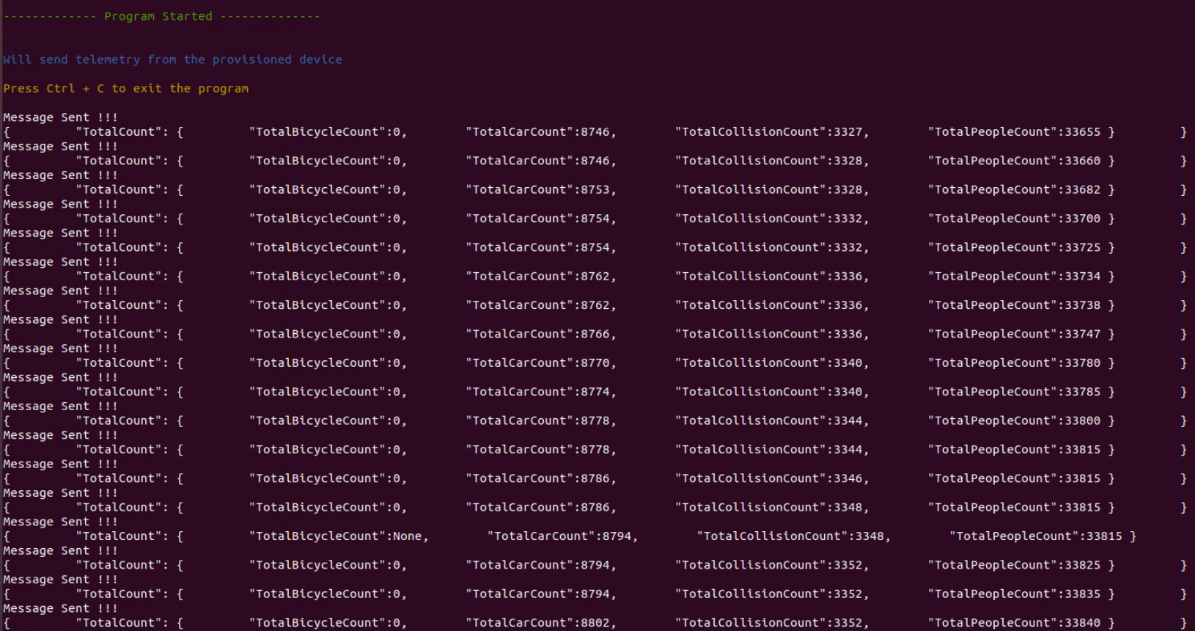
NOTE: Use device Scope ID, Device ID and Primary Key obtained from the previous step.
You can run the reference implementation in parallel to send live data.
The same script can be used with similar RIs for sending data from InfluxDB to Azure IoT Central with slight modifications in Python script and device template.
Step 5.2 Run Program on EFLOW
1. Go to the connect_edge_devices_to_azure_iot module in IoT hub that was created in the previous section.
{
    "CMD": [
        "python3",
        "Connect_Edge_Devices_to_Azure_IoT/ITM_Azure_IoT/send_telemetry.py",
        "-s",
        "<SCOPE ID>",
        "-d",
        "<DEVICE ID>",
        "-k",
        "<PRIMARY KEY>",
        "-o",
        "eflow"
    ]
}
After updating the above details, it should look similar to the following:
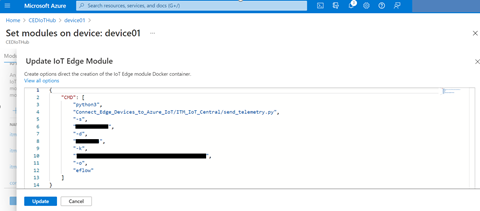
2. After adding all the required modules, click on Review + Create to proceed to the validation page.
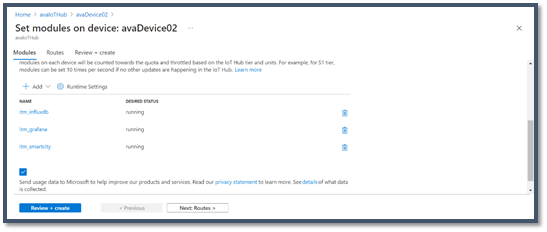
3. Once validation is done, click on Create to deploy the modules in EFLOW.
Step 6: Monitor Data in Azure IoT Central Dashboard
1. Go to your Azure IoT Central dashboard.
2. Navigate to Devices and choose the device template you created for Intelligent Traffic Management.
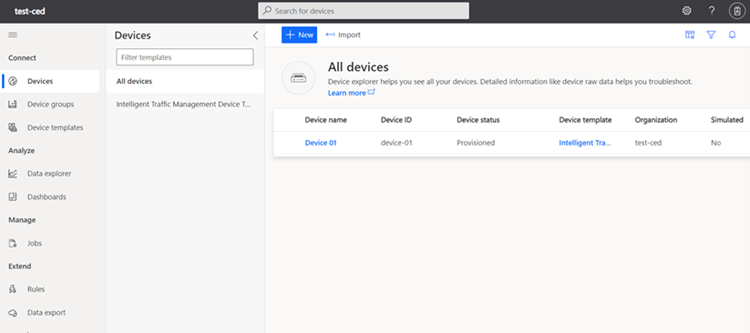
3. Click your device, then click on different tabs to view telemetry data in dashboards as shown in the following images:
- Overall View
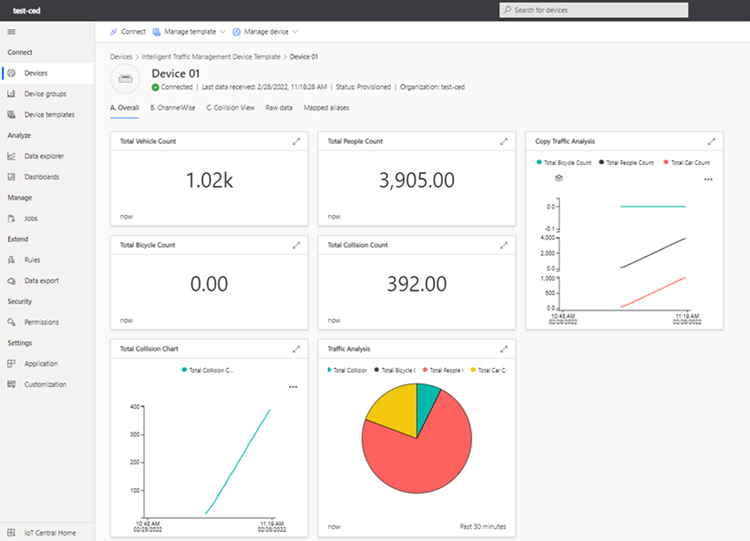
- Channel View
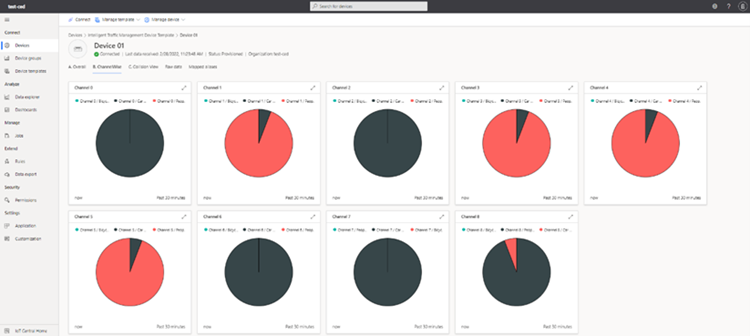
- Collision View
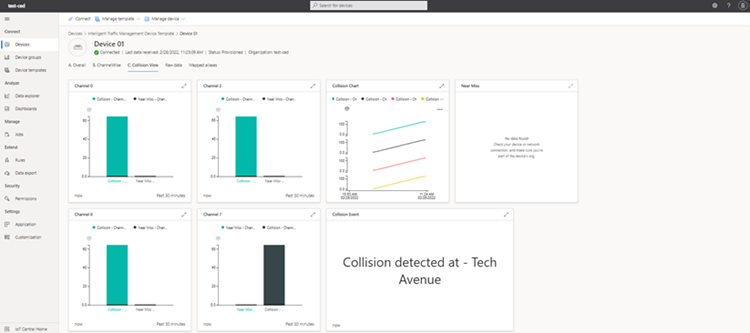
To learn more, you can add Out-of-Band Manageability functionality to your reference implementation.
Social Distancing Detection for Retail Settings Reference Implementation (Multi-Camera Detection of Social Distancing)
In this section, you will create an Azure IoT Central dashboard for Social Distancing Detection for Retail Settings Reference Implementation (Multi-Camera Detection of Social Distancing), run standalone Python* code to fetch telemetry data from InfluxDB*, and send data to the Azure IoT Central dashboard for visualizing telemetry data. You can utilize the rest of the Azure IoT Central services to meet your needs. You will be able to run this application in both the Ubuntu* Linux* and Azure IoT Edge for Linux on Windows* (EFLOW) environments.
Prerequisites
Before you continue, you must complete the following:
- If you have not done so already, install Connect Edge Device to Azure* IoT (See Step 5: Install the connect_devices_to_azure_iot).
NOTE: You are not required to run the web app or any additional steps for the installation (i.e., you are just installing to access the scripts).
- Complete the steps to install and run the Social Distancing Detection for Retail Settings reference implementation (Multi-Camera Detection of Social Distancing).
NOTE: These steps will result in building containers for the Linux environment. To build containers for the EFLOW environment, refer to the Deployment in Windows Environment section.
Deployment in Linux Environment
Visualization in Grafana
To view the inference results in your local Grafana dashboard, follow the Visualize the Map UI on Grafana instructions in the Social Distancing Detection for Retail Settings reference implementation (Multi-Camera Detection of Social Distancing).
Visualization in Azure IoT Central
To view the inference results in the IoT Central dashboard, follow the Visualization in Azure IoT Central instructions later in this guide.
Deployment in Windows EFLOW Environment
Azure IoT Edge for Linux on Windows (EFLOW) works by running a Linux virtual machine on a Windows device. The Linux virtual machine comes pre-installed with the IoT Edge runtime. Any IoT Edge modules deployed to the device runs inside the virtual machine. Meanwhile, Windows applications running on the Windows host device can communicate with the modules running in the Linux virtual machine.
EFLOW enables users to run production Linux-based cloud-native workloads on Windows IoT device, while providing only server mode access to VM and no GUI support.
Prerequisites
- If you have not done so already, install Connect Edge Device to Azure* IoT (See Step 5: Install the connect_devices_to_azure_iot in the Getting Started section above).
- Complete the steps to install and run the Social Distancing Detection for Retail Settings reference implementation (Multi-Camera Detection of Social Distancing).
- If all the required containers are already available in Azure Container Registry (ACR) or any other container registry, go directly to the Set Up Azure Resources for Deployment section. If not, build and push the containers by following the steps below.
Build Social Distancing Detection for Retail Settings (Multi-Camera Detection of Social Distancing) Docker Images
Since container images are not readily available for Social Distancing Detection for Retail Settings (Multi-Camera Detection of Social Distancing), this section will provide details to create and upload the container images to Azure Container Registry. To make the reference implementation’s containers work with Microsoft EFLOW, modify Docker file for Smart City container and build new Docker image as described below.
- Go to the reference implementation installation folder by executing the command:
cd <MCSD_INSTALL_PATH>/MultiCamera_Detection_of_Social_Distancing_<version>/Social_Distancing_Detection_for_Retail_Settings/mcss-covid19/app - Copy the resource folder from <MCSD_install_path>/mcss-covid19/ folder to <MCSD_install_path>/mcss-covid19/app folder:
cp -r ../resources/ .
- Open Dockerfile in text editor and make these changes:
Add instructions to copy resource folder and configuration.env file:
After adding instructions, it should look similar to the following:COPY resources app/resources COPY configuration.env /app/configuration.env
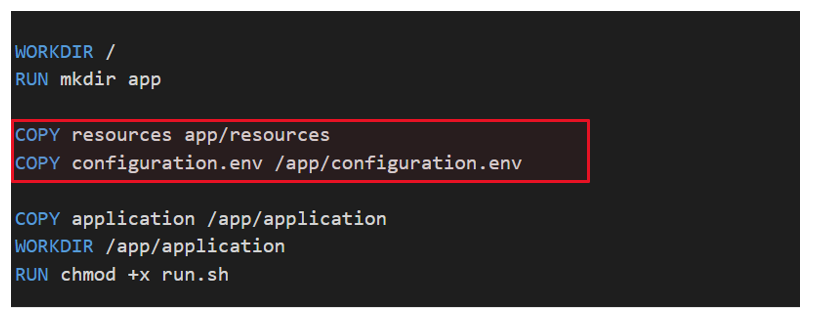
- Disable display output window to make compatible with Microsoft EFLOW:
Open run.sh script in a text editor and add --no_show argument in CMD as shown below:cd <MCSD_INSTALL_PATH>/MultiCamera_Detection_of_Social_Distancing_<version>/Social_Distancing_Detection_for_Retail_Settings/mcss-covid19/app/application/
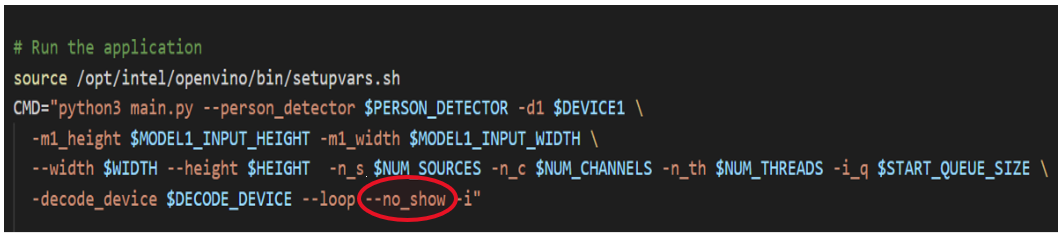
Once the changes are done, go to the app folder to build the Docker images:cd .. - Build the updated Dockerfile using the below command:
sudo docker build . -t mcss-covid19_solution:latest
Push Social Distancing Detection for Retail Settings (Multi-Camera Detection of Social Distancing) Docker Images to ACR
Follow the steps below to push Social Distancing Detection for Retail Settings (Multi-Camera Detection of Social Distancing) Docker images to ACR.
1. To create an Azure Container Registry (ACR), use the following link: Creating a container registry.
2. Go to Azure portal > container registry > choose your container registry > Access keys
Enable Admin user, get the details of container registry and please make a note of username, password, and login server for further steps.
3. Login to your Azure container registry:
sudo docker login -u <ACR username> -p <ACR password> <ACR login server>
4. Tag all Social Distancing Detection for Retail Settings (Multi-Camera Detection of Social Distancing) Docker images:
sudo docker tag mcss-covid19_solution:latest <ACR login server>/mcss-covid19_solution:latest
sudo docker tag mcss-covid19_grafana:latest <ACR login server>/mcss-covid19_grafana:latest
sudo docker tag mcss-covid19_influxdb:latest <ACR login server>/mcss-covid19_influxdb:latest
5. Push all Social Distancing Detection for Retail Settings (Multi-Camera Detection of Social Distancing) Docker images to ACR:
sudo docker push <ACR login server>/mcss-covid19_solution:latest
sudo docker push <ACR login server>/mcss-covid19_grafana:latest
sudo docker push <ACR login server>/mcss-covid19_influxdb:latest
If you have not done so already, install Connect Edge Devices to Azure* IoT (See Step 5: Install the connect_devices_to_azure_iot).
Build Connect Edge Devices to Azure IoT Docker Images
To make the Connect Edge Devices to Azure IoT work with Azure EFLOW, build it as container.
1. Go to Connect_Edge_Devices_to_Azure_IoT folder in Desktop:
cd ~/Desktop/Connect_Edge_Devices_to_Azure_IoT
2. Build Docker image:
sudo docker build . -t connect-edge-devices-to-azure-iot:latest
Push Connect Edge Devices to Azure IoT Docker Images to ACR
Follow the steps below to push Connect Edge Devices to Azure IoT Docker images to ACR.
1. Tag Connect Edge devices to Azure IoT container:
sudo docker tag connect-edge-devices-to-azure-iot:latest <ACR login server>/connect-edge-devices-to-azure-iot:latest
2. Push the container to ACR:
sudo docker push <ACR login server>/connect-edge-devices-to-azure-iot:latest
Set Up Azure Resources for Deployment
Before deploying the Reference Implementation and Connect Edge devices to Azure IoT modules on EFLOW, you must complete the following steps.
Create Azure IoT Hub
1. Follow the Create an IoT hub using the Azure portal instructions.
2. In your Azure Portal, go to your IoT Hub.
3. Under Automatic Device Management from the menu on the left, select IoT Edge.
4. Click on Add IoT Edge Device to create a new edge device for EFLOW VM. Provide a device ID and click the Save button.
5. Select the device ID of the target device you just created. Make a note of primary connection string for future reference.
Create Microsoft EFLOW device
To create an EFLOW device, follow the Microsoft installation guide.
During the provisioning step, choose manual provisioning and provide the connection string of your IoT hub.
Deploy Reference solution in EFLOW
For deploying IoT modules which are pushed into ACR, follow the steps below.
1. Go to IoT device that is created in IoT hub in previous step, select the Module Settings tab.
2. On the container registry credential, provide the details of your Azure Container Registry that you have created in previous section. The username, password, and login server address can be found in your registry, under Settings in the Access keys section.
3. On the IoT Edge Modules, choose Add and select to add an IoT Edge Module. We need to add all the MCSS containers as IoT edge Module to IoT Edge Deployment to EFLOW VM.
The edge modules listed below are added by referencing to MCSS RIs docker compose file along with Connect Edge devices to Azure IoT.
| Container | Edge Module Name | Startup Order | Image URI |
| influx DB | mcss-influxdb | 1 | As per docker image URI in ACR |
| grafana | mcss-grafana | 2 | As per docker image URI in ACR |
| mcss-covid19 | mcss-application | 3 | As per docker image URI in ACR |
| connect Edge Devices to Azure IoT | connect_edge_devices_to_azure_iot | 4 | As per docker image URI in ACR |
The dialog will look similar to:
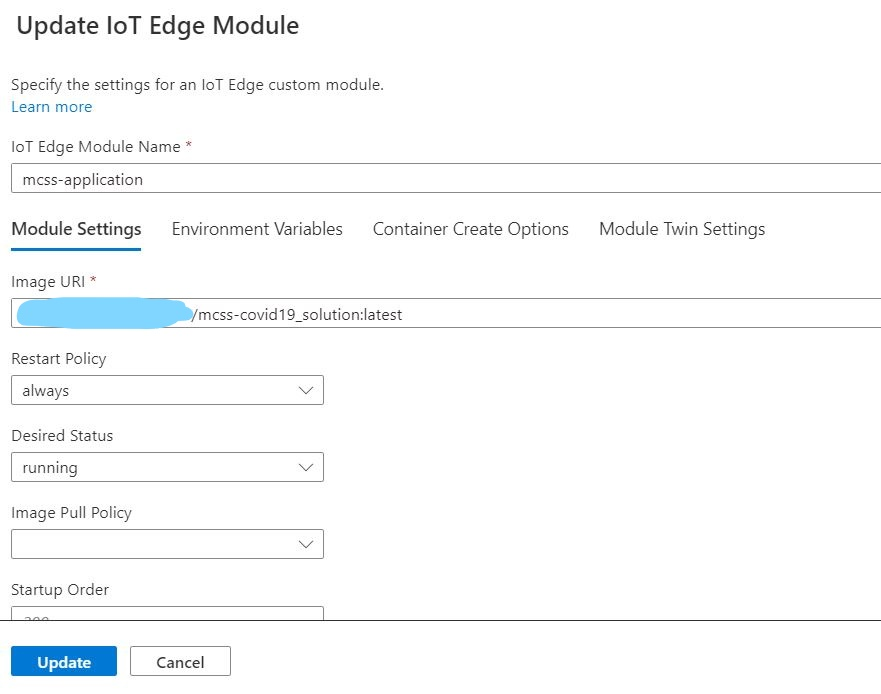
4. The mcss-application, influxdb, and grafana modules will need to have some more information under the Environment Variables and Container Create Options tabs:
- The mcss-application container has several environment variables that need to be added for the container to run in the EFLOW environment.
Environment Variable Type Value display Text $DISPLAY DEVICE1 Text CPU PERSON_DETECTOR Text /intel/person-detection-retail-0013/FP32/person-detection-retail-0013.xml MODEL1_INPUT_HEIGHT Text 480 MODEL1_INPUT_WIDTH Text 816 WIDTH Text 1280 HEIGHT Text 720 NUM_THREADS Text 3 START_QUEUE_SIZE Text 10 NUM_SOURCES Text 1 NUM_CHANNELS Text 2 MIN_SOCIAL_DIST1 Text 80 DECODE_DEVICE Text CPU INPUT_SOURCE1 Text /app/resources/Pexels Videos 2670.mp4
After updating the environment variables in IoT Edge Module, the screen will look similar to:
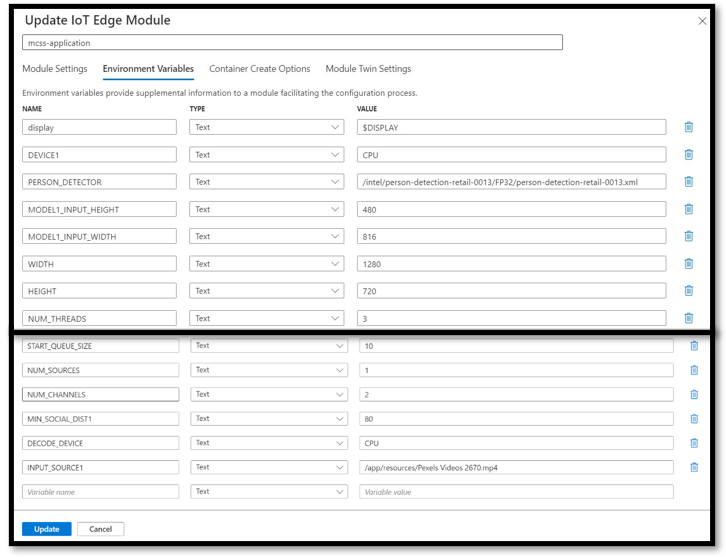
-
The mcss-application container will have port bindings and volume mount that need to be accessed by container. Update these settings as per the docker-compose.yml file under the Container Create Options.
Refer to the code snippet and screenshot below for details.
Container Create Options{ "NetworkingConfig": { "EndpointsConfig": { "host": {} } }, "HostConfig": { "Devices": [ { "PathOnHost": "/dev/", "PathInContainer": "/dev/", "CgroupPermissions": "rwm" } ], "NetworkMode": "host", "Binds": [ "/dev:/dev", "/var/tmp:/var/tmp" ] } }
After updating the above details, it should look similar to:
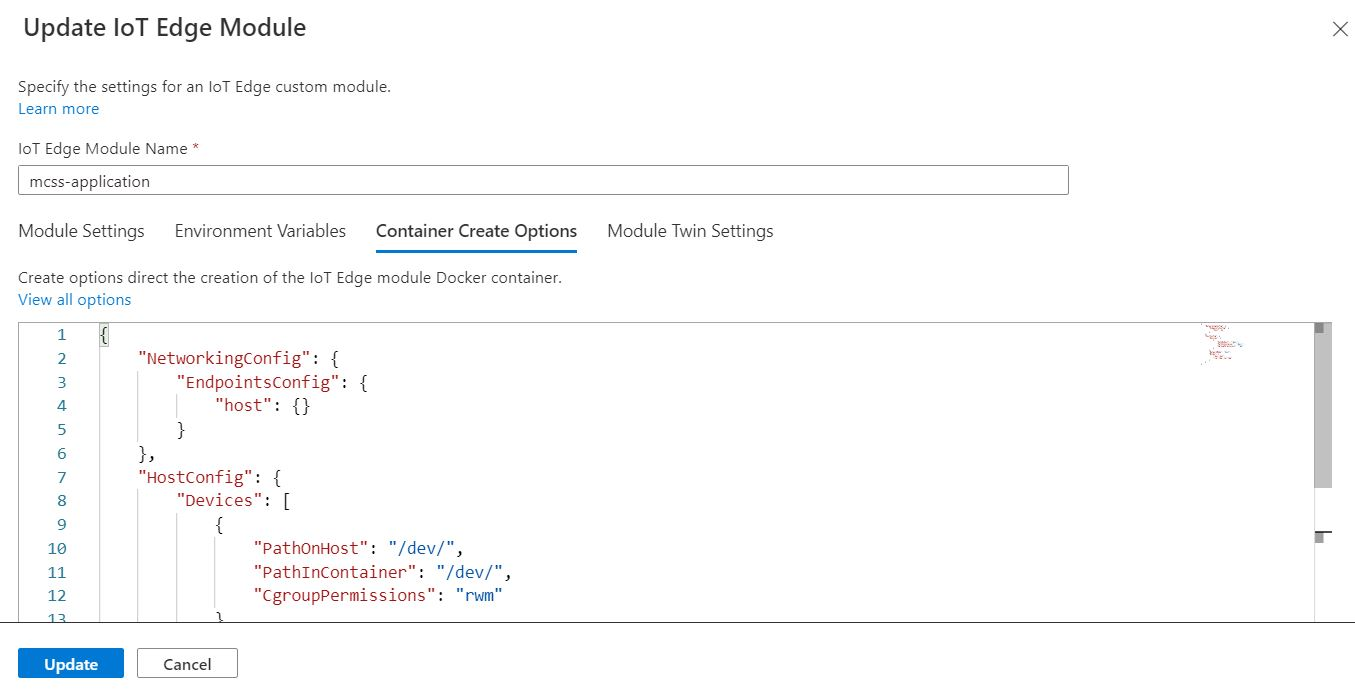
-
The influxdb container has several environment variables that need to be added for the container to run in the EFLOW environment.
Environment Variable Type Value INFLUX_USER Text admin INFLUX_PASSWORD Text admin INFLUX_DB Text McssCovid INFLUXDB_HTTP_ENABLED Text true After updating the environment variables in IoT Edge Module, the screen will look similar to:
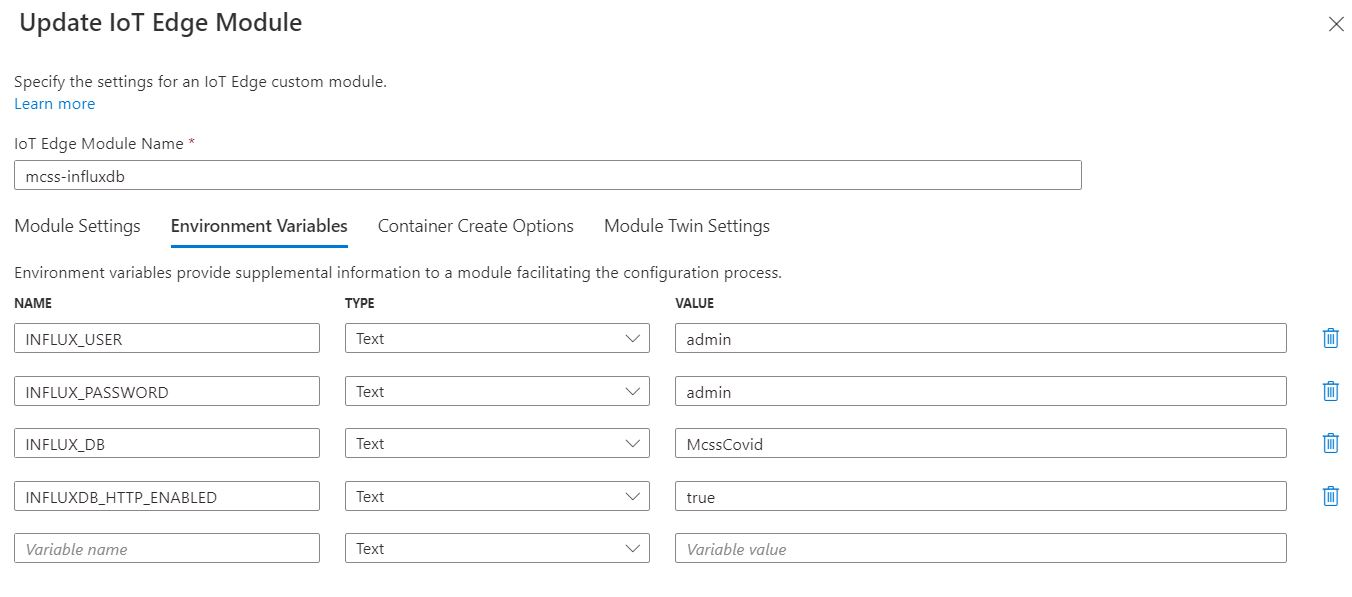
The influxdb container will have port bindings that need to be accessed by container. Update these settings as per the docker-compose.yml file under the Container Create Options.
Refer to the code snippet and screenshot below for details.
Container Create Options{ "HostConfig": { "PortBindings": { "8086/tcp": [ { "HostPort": "8086" } ] } } }
After updating the above details, it should look similar to:
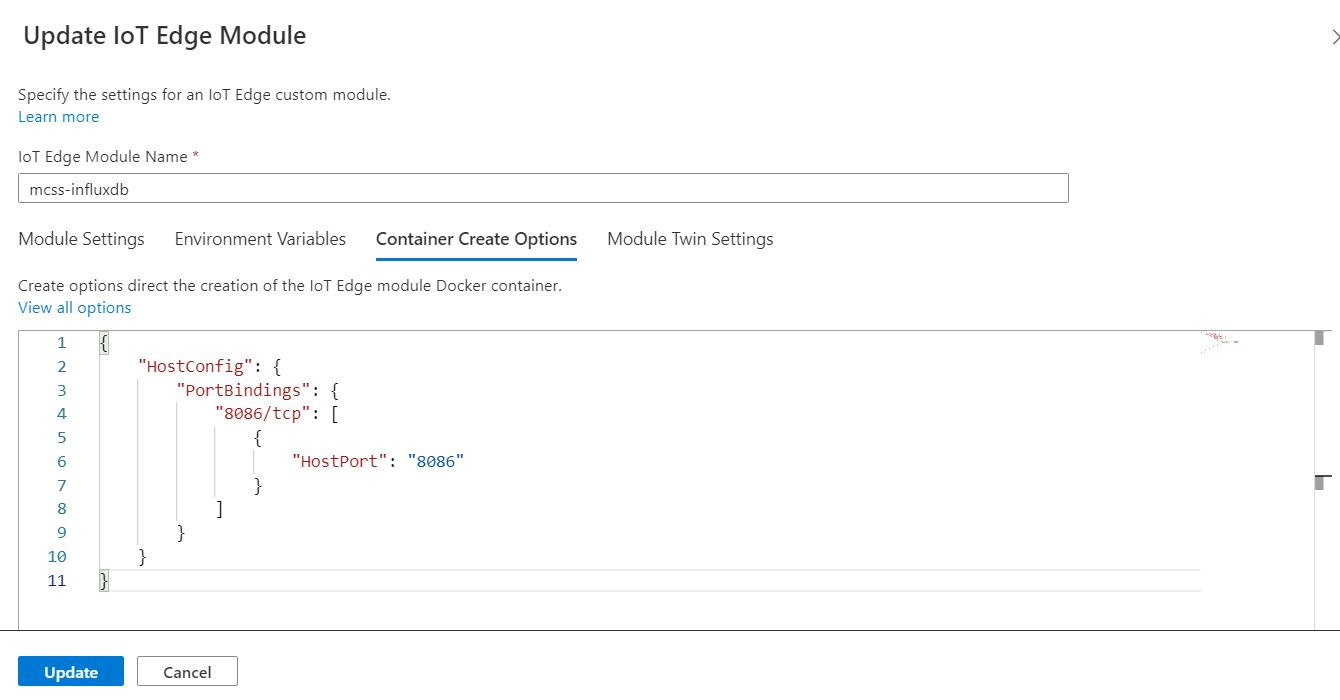
-
The grafana container has several environment variables that need to be added for the container to run in the EFLOW environment.
Environment Variable Type Value GF_SECURITY_ADMIN_USER Text admin GF_SECURITY_ADMIN_PASSWORD Text admin After updating the environment variables in IoT Edge Module, the screen will look similar to:
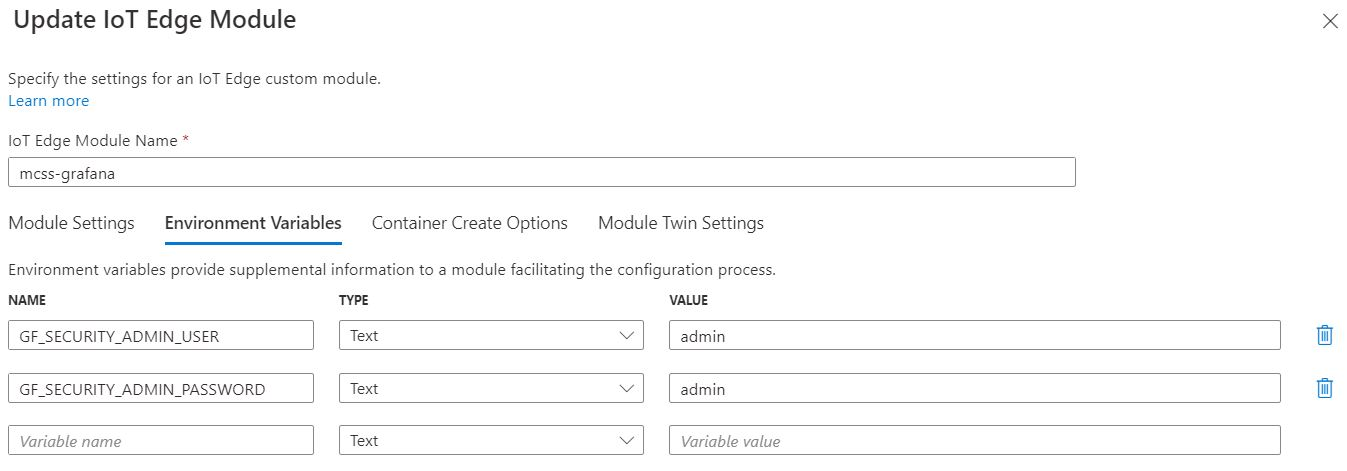
The grafana container will have port bindings that need to be accessed by container. Update these settings as per the docker-compose.yml file under the Container Create Options.
Refer to the code snippet and screenshot below for details.
Container Create Options{ "HostConfig": { "PortBindings": { "3000/tcp": [ { "HostPort": "3000" } ] } } }
After updating the above details, it should look similar to:
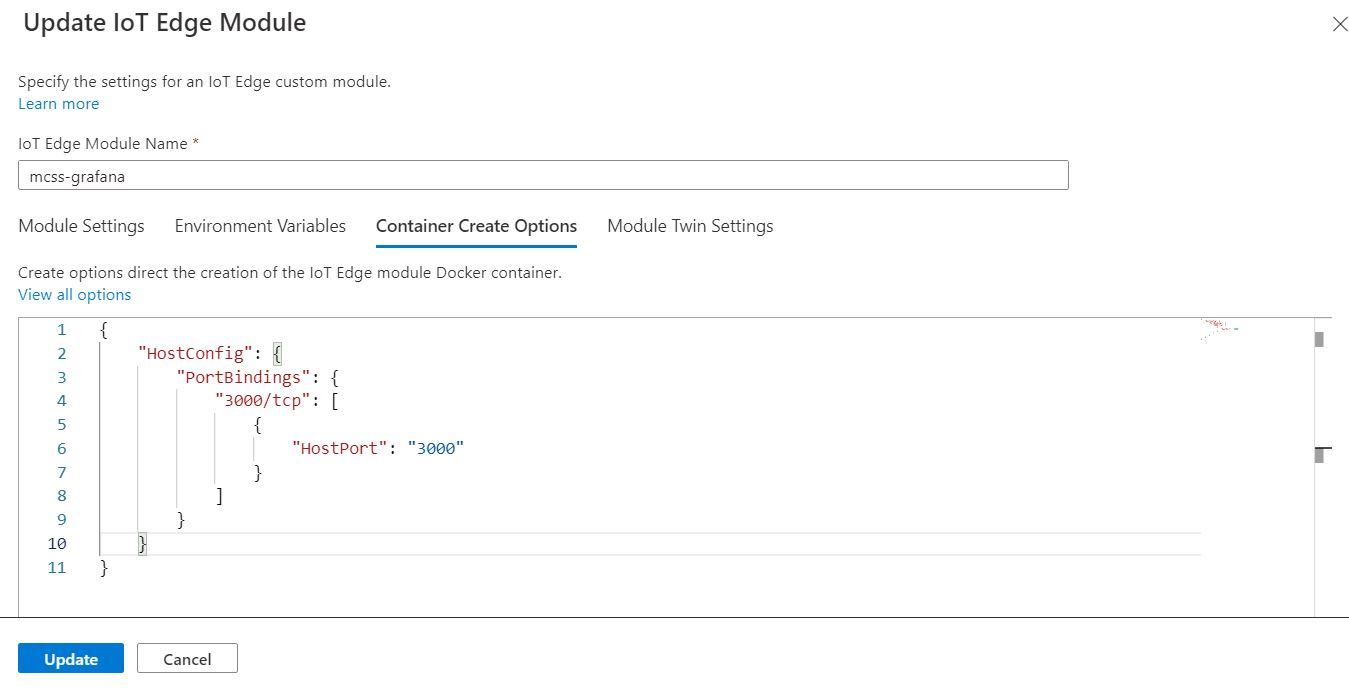
5. Once validation is done, click on Create to deploy the modules in EFLOW.
Monitoring Edge Device
Using Windows Admin Center
After successful setup/deployment of EFLOW, you can connect to your EFLOW VM from Windows Admin Center and see the status of your edge modules as shown below:
NOTE: Make a note of the IP address for viewing Grafana Dashboard.
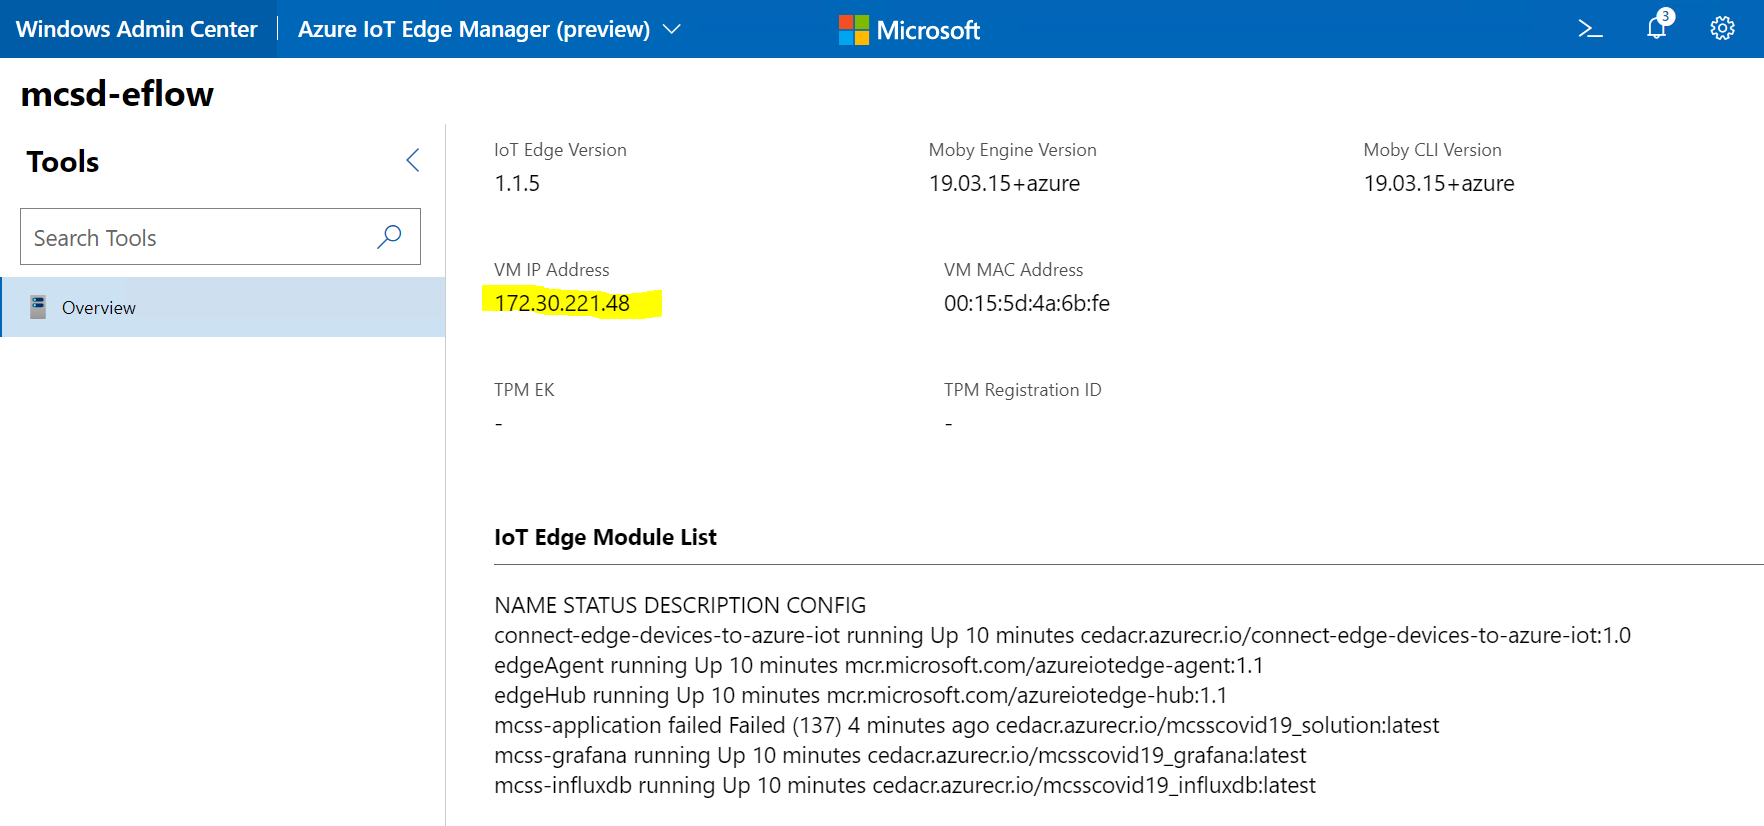
Using Windows PowerShell
- Connect to your EFLOW VM from windows machine by executing this command in PowerShell:
Connect-EflowVM -
Run the below command to see the deployed list of edge modules:
sudo iotedge list
You should see output similar to:
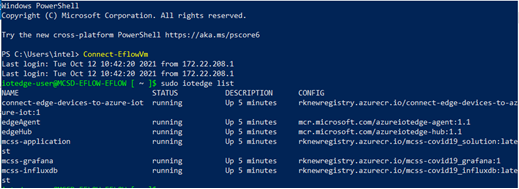
-
To check the logs of edge modules, execute the command:
sudo iotedge logs <edge module name>
Visualization in Grafana
To view the inference results in your local Grafana dashboard, open a browser on the Windows machine that hosts the EFLOW VM and navigate to: <EFLOW VM IP address>:3000
- Log in with User as admin and password as admin.
- To get the data from influxDB, click on Settings icon from left panel > click data sources > click Mcss Covid
- Under HTTP section, update the URL to http://mcss-influxdb:8086
- Under InfluxDB Details section, provide database as McssCovid.
- Click on Save and Test.
- Go to Home and select Multi Camera Covid19 solution to open the main dashboard.
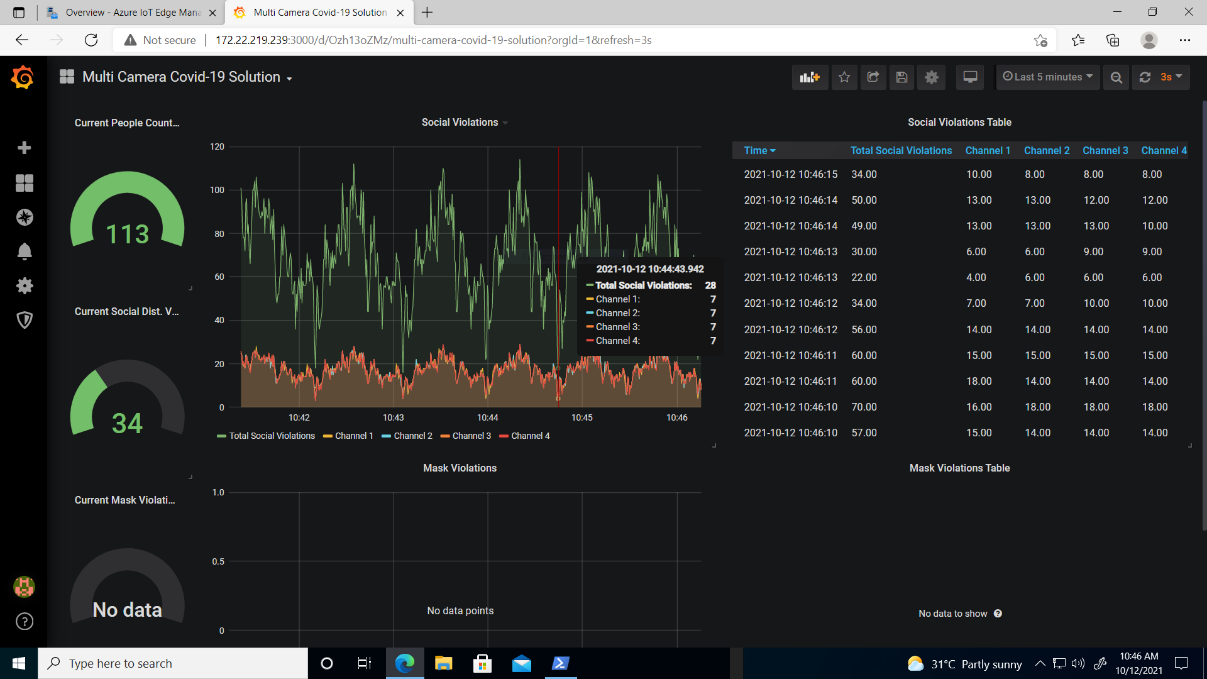
Visualization in Azure IoT Central
This section contains instructions for both Linux and EFLOW.
Step 1: Create Azure IoT Central Dashboard
- To create an Azure IoT Central dashboard, follow these instructions.
Step 2: Create Device Template
- To create a device template, follow these steps:
- Go to the Azure IoT Central application that you created in step 1, then navigate to Device templates and choose +New.
- On the Select template type page, choose the IoT Device tile. Then select Next: Customize.
- On the Customize page, provide a name for the device template and select Next: Review.
NOTE: You do not need to select the check box for Gateway device with downstream devices.
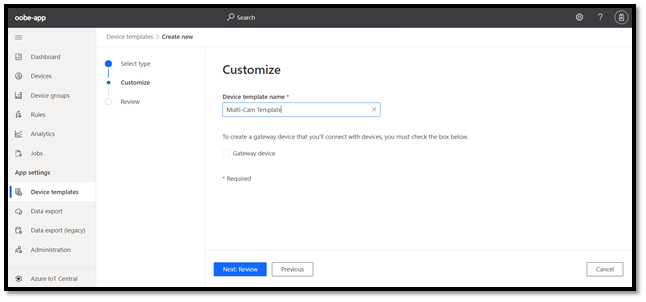
- On the Review page, select Create.
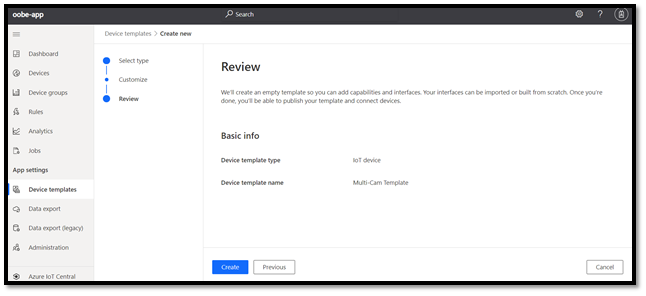
- Click on Import a model and upload the capability model MCSD_DCM.json.
The typical path is: ~/Desktop/Connect_Edge_Devices_to_Azure_IoT/MCSD_Azure_IoT/
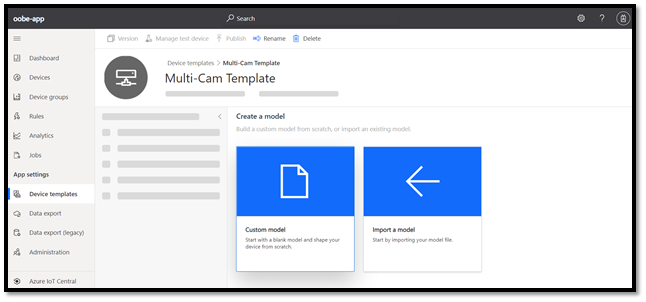
- To create an overall view, click Views and choose Visualizing the Device. Provide a View Name, for example, View-Overall and add the following tiles to the view. Click on Start with devices and choose telemetry names from the drop-down.
SI No. Telemetry Name Visualizing Panel Size 1 Total People Count Line Chart 2x2 2 Total Social Distance Violation Line Chart 2x2 3 Total People Count Heat Map 2x2 4 Total Social Distance Violation Heat Map 2x2 5 Total People Count,
Total Social Distance ViolationPie Chart 2x2 6 Total People Count,
Total Social Distance ViolationBar Chart 2x2 7 Total People Count,
Total Social Distance ViolationKPI 2x2 8 Total People Count Last Known Value 2x1 9 Total Social Distance Violation Last Known Value 2x1
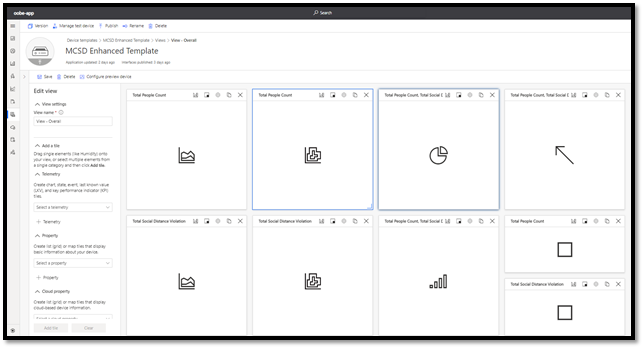
- To create a channel-wise view, click Views and choose Visualizing the Device. Provide a View Name, for example, Channel View and add the following tiles to the view. Click on Start with devices and choose telemetry names from the drop-down.
SI No. Telemetry Name Visualizing Panel Size 1 People Count - Channel 01 Last Known Value 2x2 2 People Count - Channel 02 Last Known Value 2x2 3 Social Distance Violation - Channel 01 Last Known Value 3x2 4 Social Distance Violation - Channel 02 Last Known Value 3x2 5 People Count - Channel 01,
Social Distance Violation - Channel 01Pie Chart 2x2 6 People Count - Channel 02,
Social Distance Violation - Channel 02Pie Chart 2x2 7 People Count - Channel 01,
People Count - Channel 02Bar Chart 2x2 8 Social Distance Violation - Channel 01,
Social Distance Violation - Channel 02Bar Chart 2x2
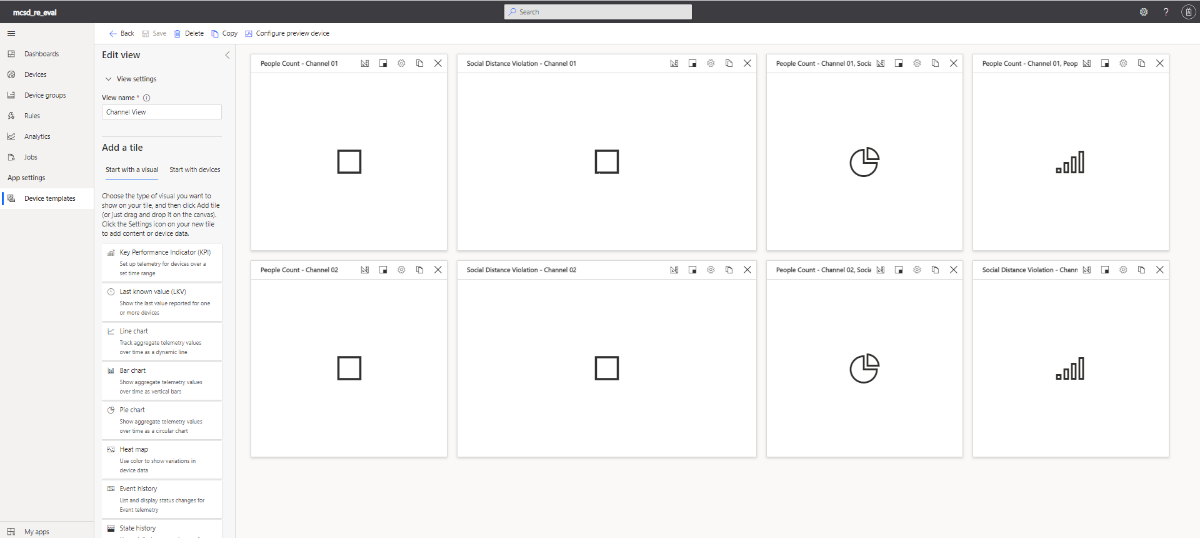
- Click Publish on the top panel. When prompted, click the Publish button to publish your device template.
Step 3: Add Device to Device Template
In the next series of steps, you will attach an edge device to your published Multi-Cam device template.
- In your Azure IoT Central application, navigate to the Devices page and choose the template you created in the previous step.
- Click on + New to add the new device to the template.
- Provide the required details and click Create (refer to the screenshot below).
- Make sure you choose the right device template from the drop-down box.
- Give a display name to your device.
- Provide a device ID.
- Do not enable the Simulate this device option.
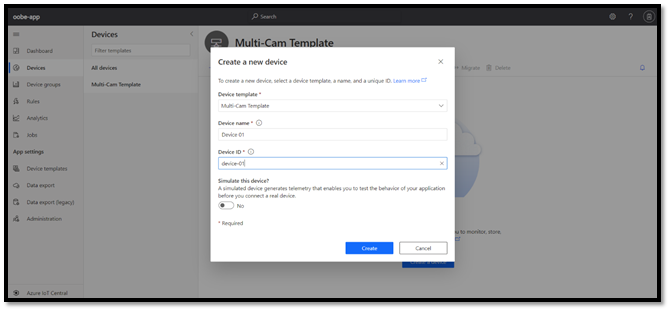
Step 4: Get Device Connection Parameters
In the next series of steps, you will view device connection parameters of the Azure IoT Central device.
- On the Device page, select the device you created in the previous step.
- Select Connect.
- Make a note of the ID Scope, Device ID, and Primary Key values.
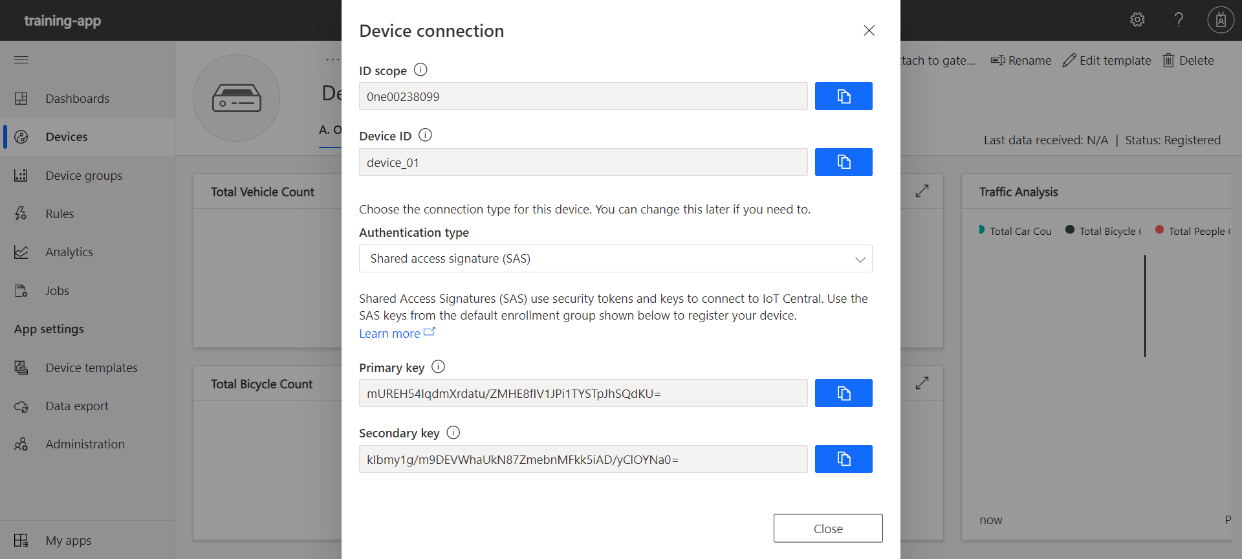
Step 5: Run Program to Connect to Azure Dashboard
This section describes how to run a program that fetches data from the InfluxDB and sends the data to the Azure IoT Central dashboard. There are different steps for Linux and for EFLOW.
Step 5.1: Run Program on Linux
- Go to the MCSD_Azure_IoT directory:
cd ~/Desktop/Connect_Edge_Devices_to_Azure_IoT/MCSD_Azure_IoT/ - Enter the command below using the parameters from the previous step.
chmod +x connect.sh
./connect.sh -s <ID SCOPE> -d <DEVICE ID> -k <PRIMARY KEY>
You will see output simillar to:
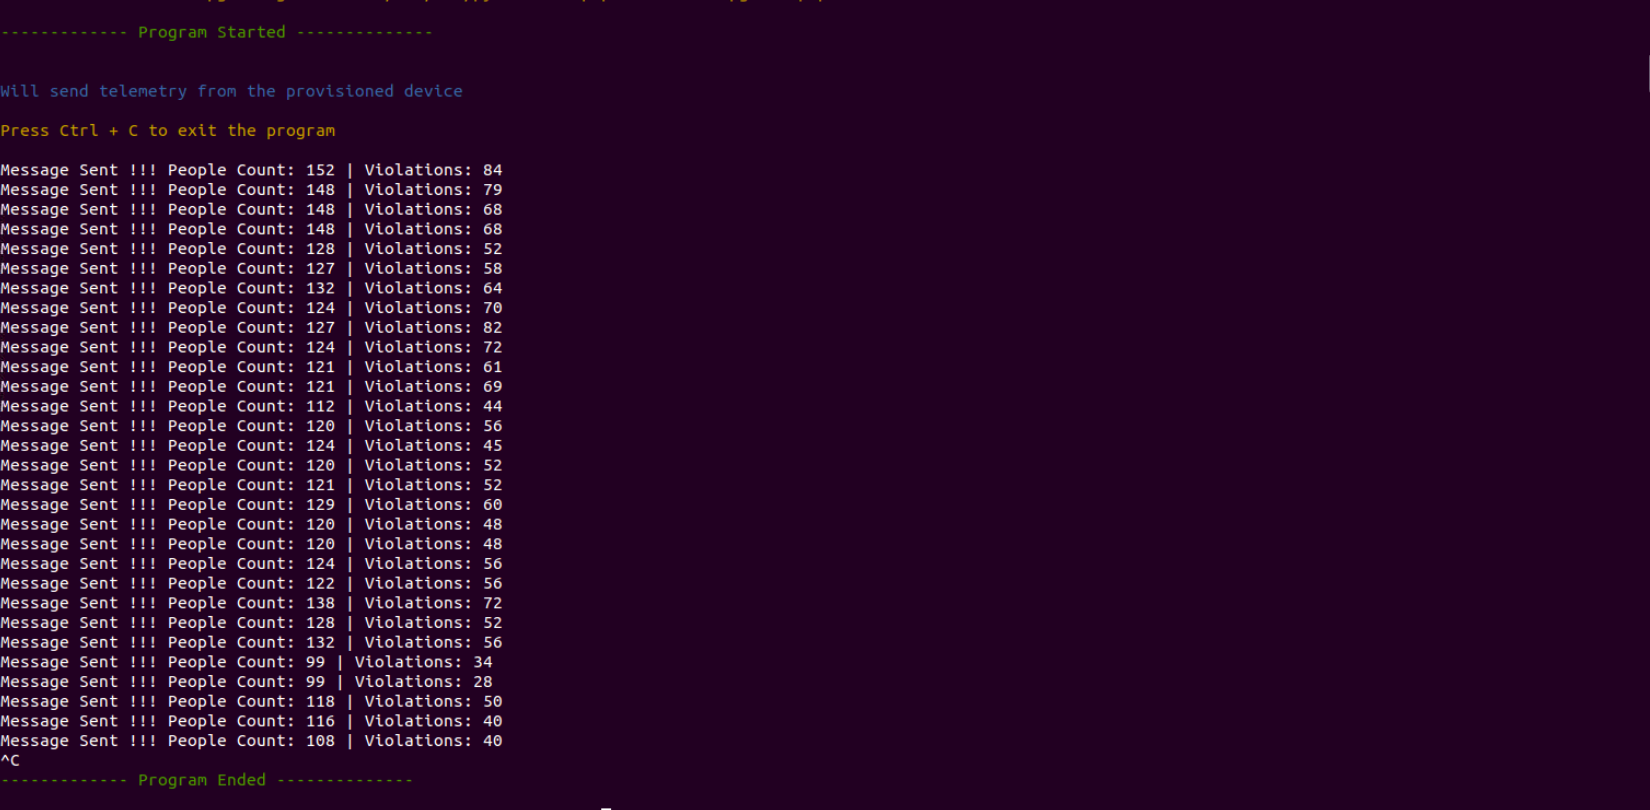
NOTE: Use device Scope ID, Device ID and Primary Key obtained from the previous step.
You can run the reference implementation in parallel to send live data.
The same script can be used with similar reference implementations for sending data from InfluxDB to Azure IoT central with slight modifications in Python script and device template.
Step 5.2: Run Program on EFLOW
- Go to the connect_edge_devices_to_azure_iot module in IoT hub that was created in the previous section.
{
    "CMD": [
        "python3","Connect_Edge_Devices_to_Azure_IoT/MCSD_Azure_IoT/send_telemetry.py",
        "-s",
        "<SCOPE ID>",
        "-d",
        "<DEVICE ID>",
        "-k",
        "<PRIMARY KEY>",
        "-o",
        "eflow"
    ]
}
After updating the details above, it should look similar to:
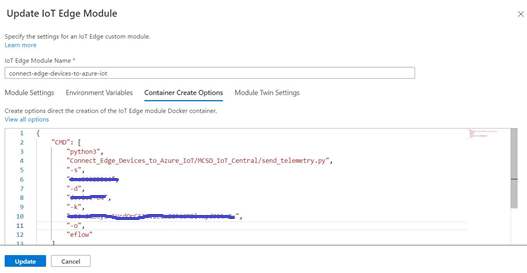
-
After adding all the required modules, click on Review + Create to proceed to the validation page.
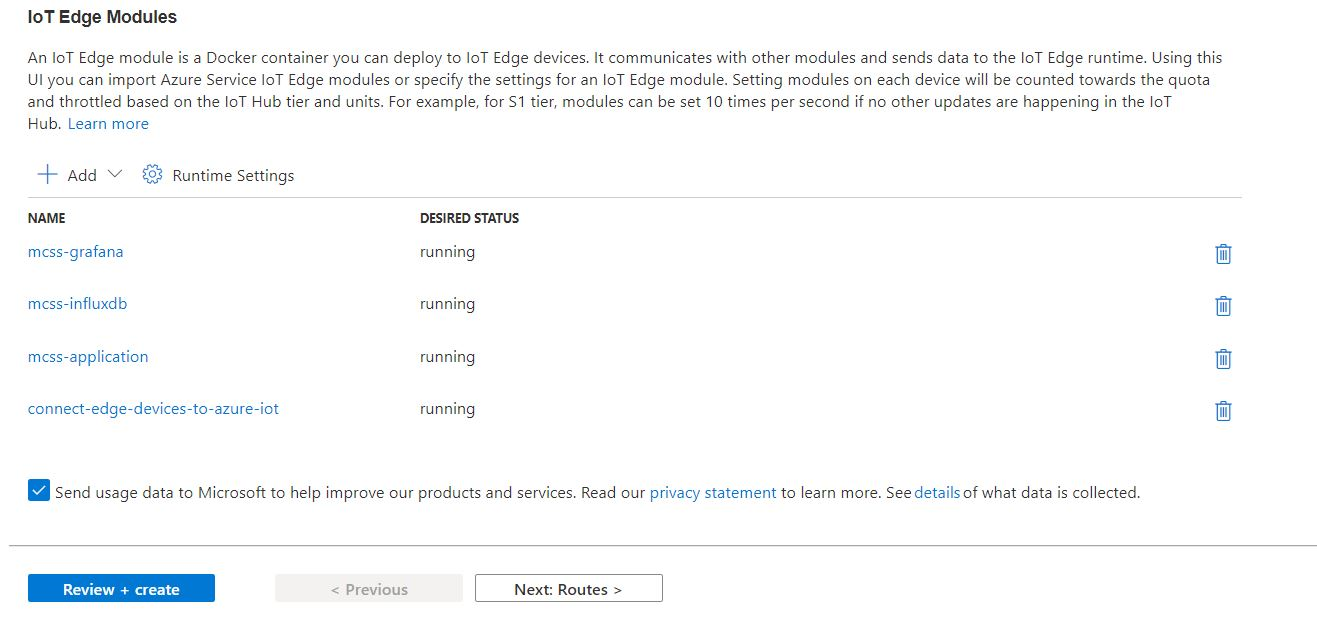
-
Once validation is done, click on Create to deploy the modules in EFLOW.
Step 6: Monitor Data in Azure IoT Central Dashboard
In the following series of steps, you will monitor data exported to your Azure IoT Central dashboard.
- Go to your Azure IoT Central dashboard.
- Navigate to Devices and choose the device template you created for Multi-Camera.
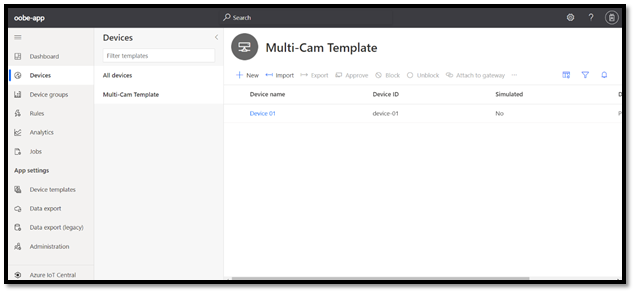
- Click your device, then click the View-Channel tab to display channel-wise telemetry data in the dashboard as shown in the following image:
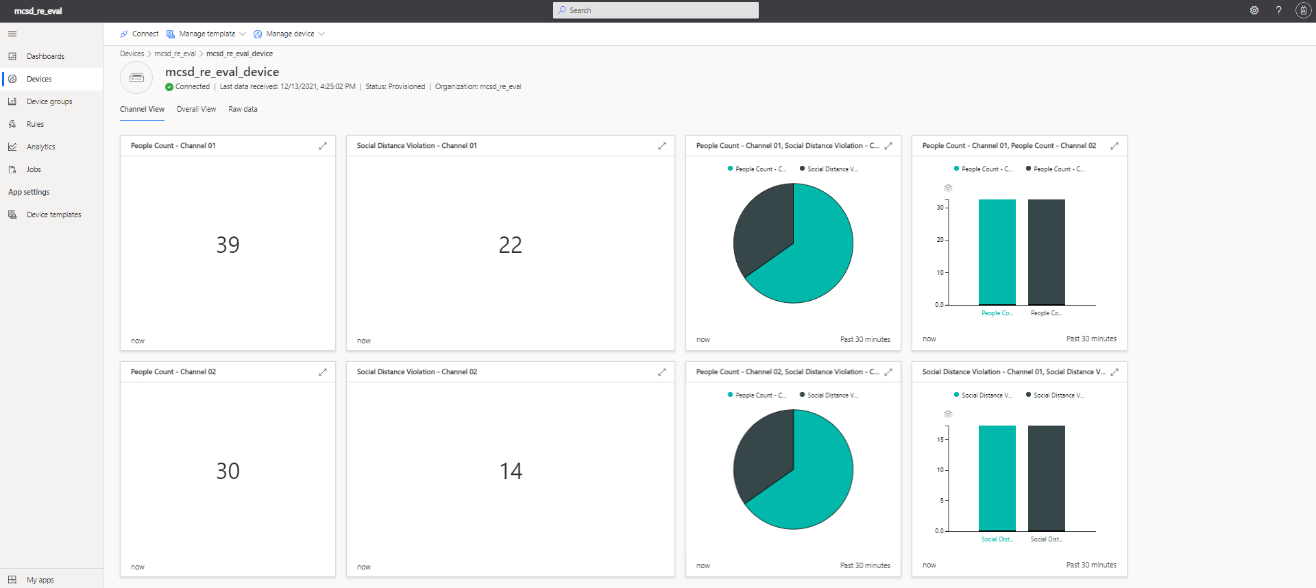
- Click the View-Overall tab to display overall telemetry data in the dashboard as shown in the following image:
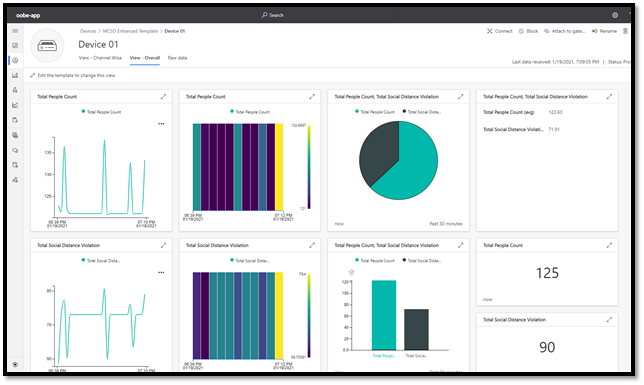
To learn more, you can add Out-of-Band Manageability functionality to your reference implementation.
Rotor Bearing Defect Detector Reference Implementation
In this section, you will create an Azure IoT Central dashboard for a reference implementation, run standalone Python code to fetch telemetry data from InfluxDB, and send data to the Azure IoT Central dashboard for visualizing telemetry data. You will also find steps to perform Analytics, set up Azure Event Hub, and visualize vibration data using Time Series Insights. You can utilize the rest of the Azure IoT Central services to meet your needs.
Prerequisites
Before you continue, you must complete the following:
1. Stop below services if it’s running in system:
IoT Edge Daemon:
sudo systemctl stop iotedge
InfluxDB:
sudo systemctl stop influxd
Mosquitto* MQTT broker:
sudo systemctl stop mosquitto
Grafana*:
sudo systemctl stop grafana-server
2. If you have not done so already, install Connect Edge Device to Azure* IoT (See Step 5: Install the connect_devices_to_azure_iot).
NOTE: You are not required to run the web app or any additional steps for the installation (i.e., you are just installing to access the scripts).
3. Complete the steps to install and run the Rotor Bearing Defect Detector reference implementation.
Development Mode
NOTE: These instructions can also be found in the Rotor Bearing Defect Detector Documentation in the Customize Application section.
By default, the application starts to run in Production Mode when the package installation is completed. If you run into any issues in Production Mode, follow the instructions below to change to Development Mode. After successfully installing the reference implementation, follow the steps below to run the application in Development Mode:
1. To switch to Development mode, navigate to the Edge Insights for Industrial /build directory:
cd <install_directory>/Rotor_Bearing_Defect_Detector_<version>/IEdgeInsights/build
2. Follow below steps to edit .env file:
vim .env
3. Go to line no.26 and change value of DEV_MODE=true
NOTE: Edge Insights for Industrial (EII) software package was previously named Edge Insights Software (EIS) and some screenshots may still refer to EIS.
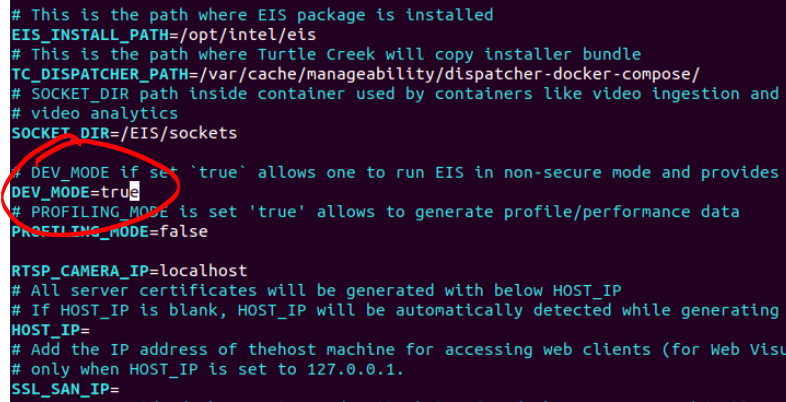
4. Save the file.
5. Run the following commands to customize the application.
python3.6 eis_builder.py -f time-series.yml
cd provision
sudo ./provision_eis.sh ../docker-compose.yml
cd ..
docker-compose build
docker run --rm -d -p 1883:1883 --name mosquitto_1883 trafex/alpine-mosquitto
docker-compose up
NOTE: If you run into any permission issues while executing Docker commands, execute the commands above as root user.
NOTE: If executing command to start Mosquitto container results in container name conflict error, please run the command below and try again:
sudo docker stop $(sudo docker ps -q --filter expose=1883)
Step 1: Create Azure IoT Central Dashboard
To create an Azure IoT Central dashboard, follow these instructions. (Skip this step if you already have an IoT Central Application).
Step 2: Create Device Template
- To create a device template, follow these steps:
- Go to the Azure IoT Central application that you created in step 1, then navigate to Device templates and choose +New.
- On the Select template type page, choose the IoT Device tile. Then select Next: Customize.
2. On the Customize page, provide a name for the device template and select Next: Review.
NOTE: You do not need to select the check box for Gateway device with downstream devices.
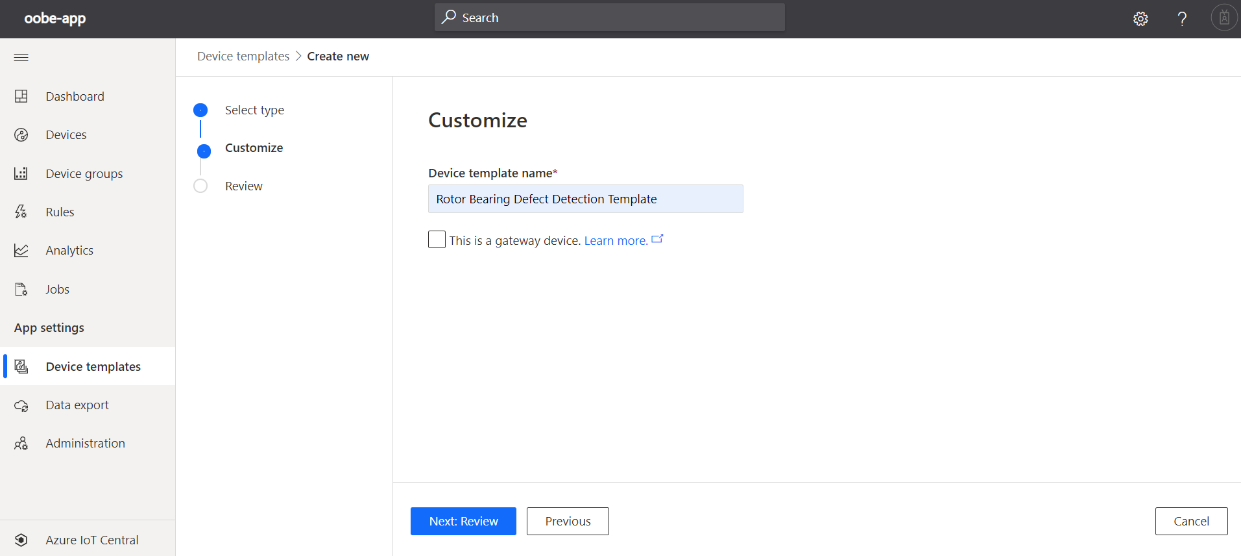
3. On the Review page, select Create.
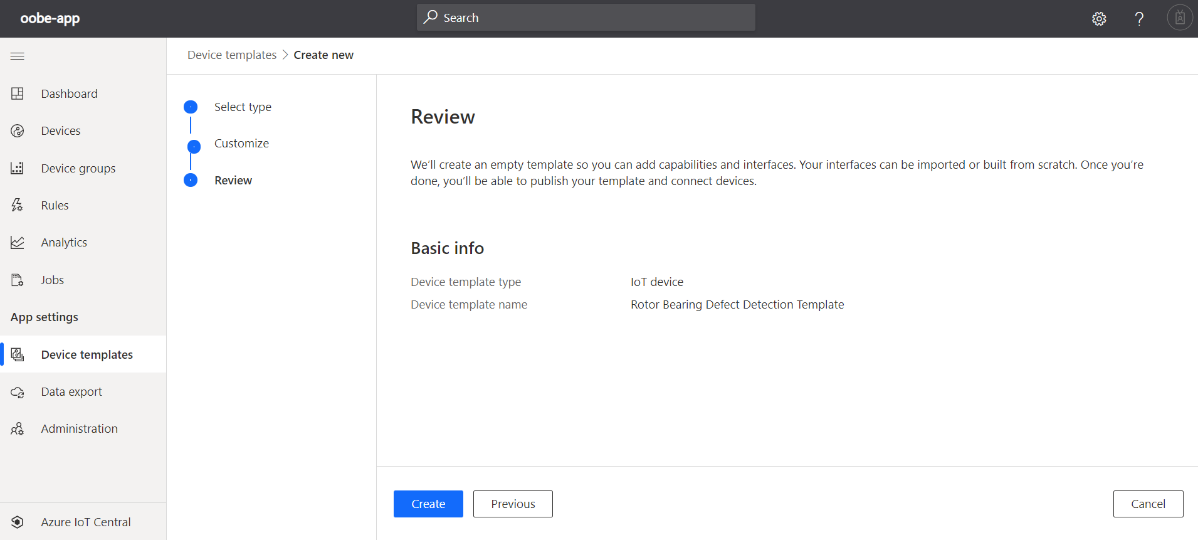
4. Click on Import a model and upload the capability model RBD_DCM.json.
The typical path is: ~/Desktop/Connect_Edge_Devices_to_Azure_IoT/RBD_Azure_IoT/
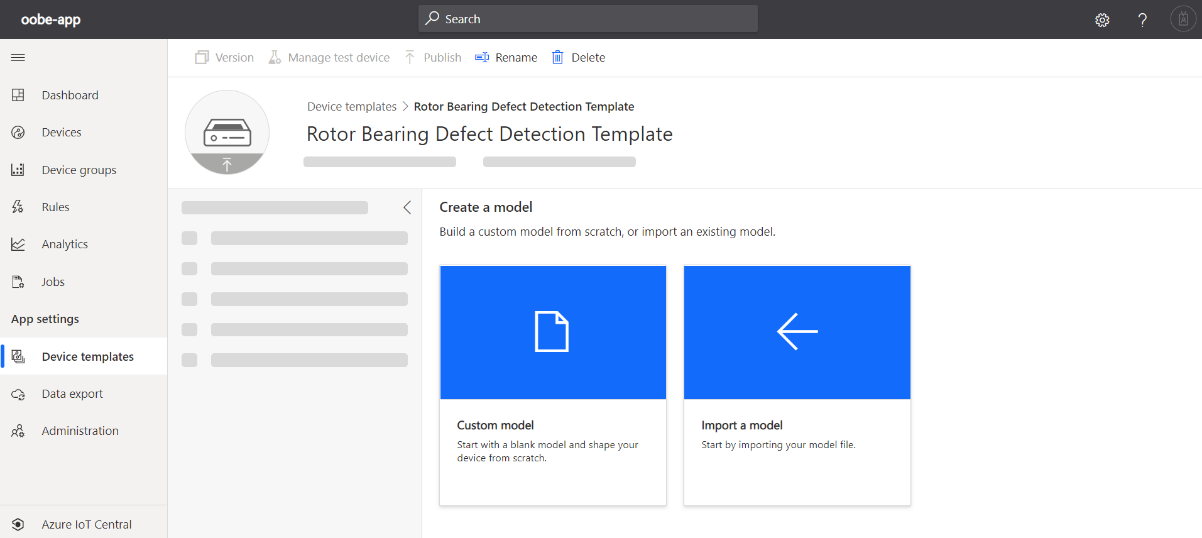
5. To create a channel-wise view, click Views and choose Visualizing the Device. Add the following tiles to the view. Click on Start with devices and choose telemetry names from the drop-down.
| SI No. | Telemetry Name | Visualizing Panel | Size |
|---|---|---|---|
| 1 | Vibration Signal | Line Chart | 3x3 |
| 2 | Inference Result | Last Known Value | 2x1 |
| 3 | Inference Result | Pie chart | 2x2 |
| 4 | Inference Index | Line Chart** | 2x2 |
** Select Display Range as ‘last 100 value' in chart configure options.
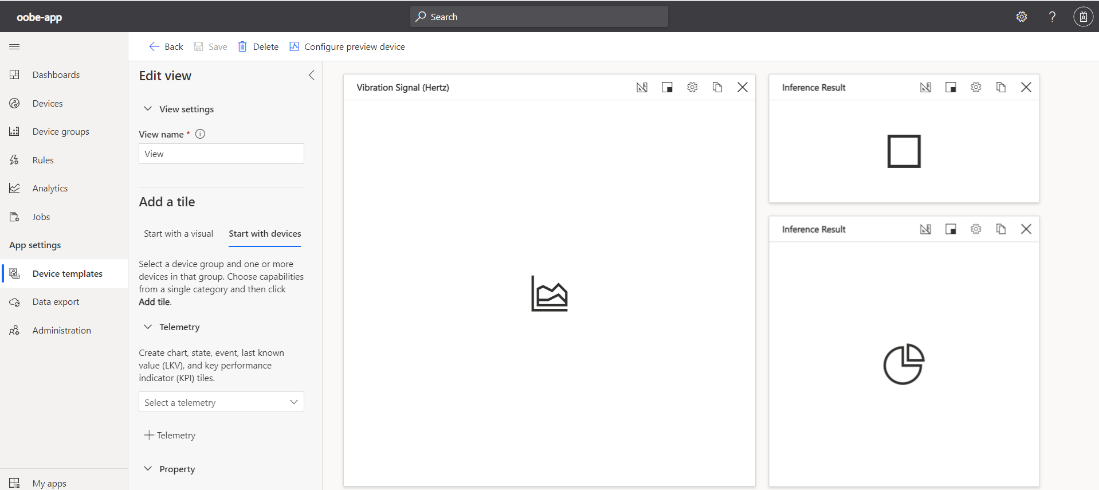
6. Click Publish on the top panel. When prompted, click the Publish button to publish your device template.
Step 3: Add Device to Device Template
- In your Azure IoT Central application, navigate to the Devices page and choose the template you created in the previous step.
- Click on + New to add the new device to the template.
- Provide the required details and click Create (refer to the screenshot below).
- Make sure you choose the right device template from the drop-down box.
- Give a display name to your device.
- Provide a device ID.
- Do not enable the Simulate this device option.
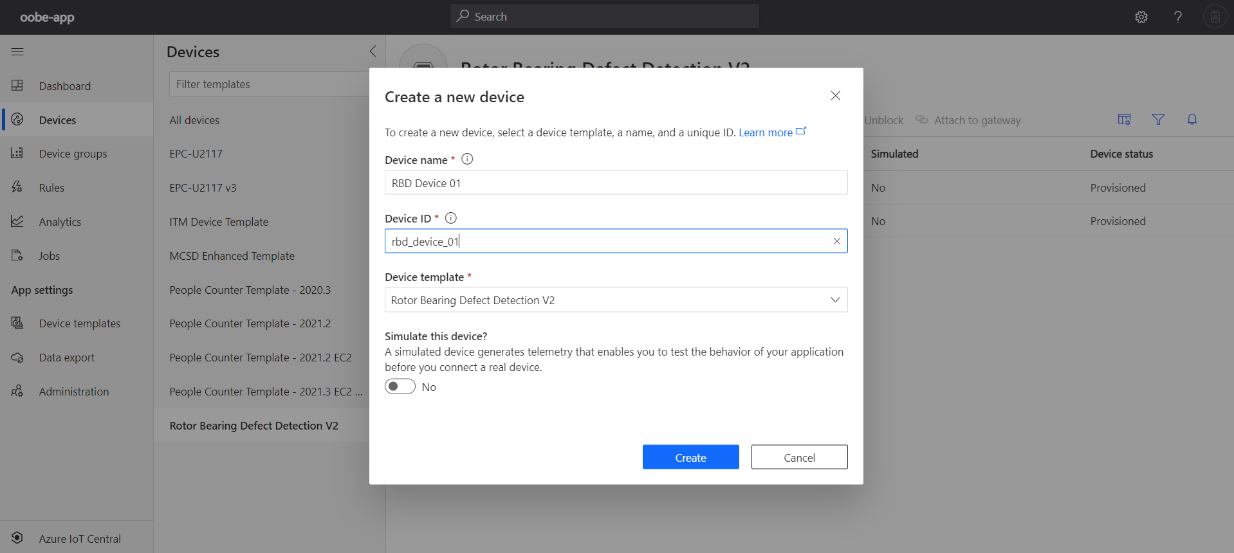
Step 4: Get Device Connection Parameters
- View and record the device connection parameters of the Azure IoT Central device.
- On the Device page, select the device you created in the previous step.
- Select Connect.
- Make a note of the ID Scope, Device ID, and Primary Key values.
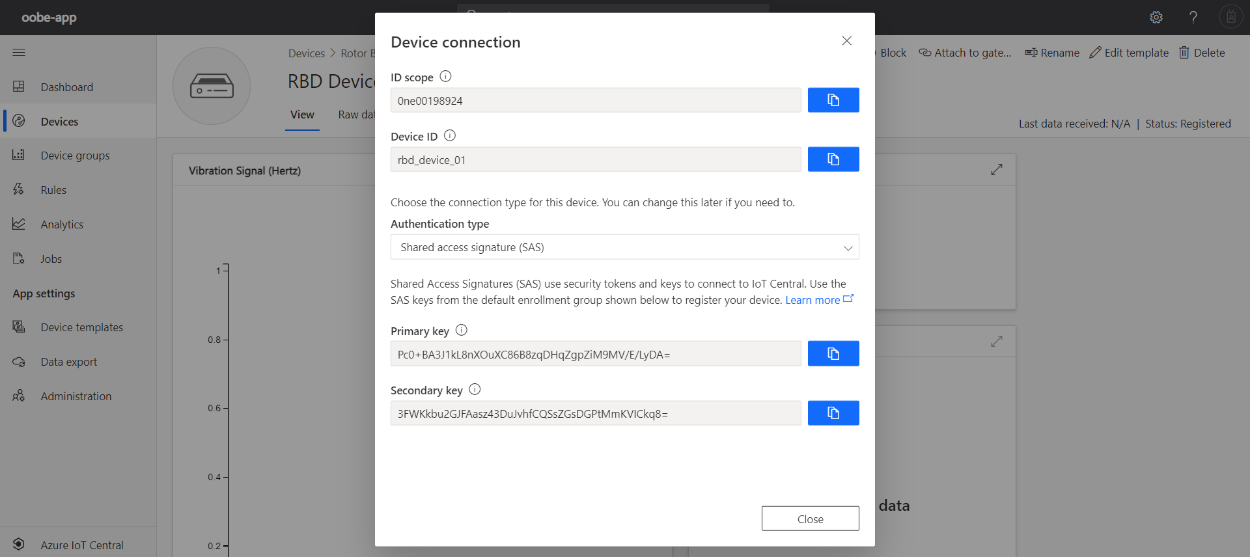
Step 5: Run Program to Connect to Azure Dashboard
Run a program that fetches data from the InfluxDB and sends the data to the Azure IoT Central dashboard.
1. Go to the RBD_Azure_IoT directory:
cd ~/Desktop/Connect_Edge_Devices_to_Azure_IoT/RBD_Azure_IoT/
2. Enter the command below using the parameters from the previous step.
chmod +x connect.sh
./connect.sh -s <SCOPE ID> -d <DEVICE ID> -k <PRIMARY KEY> -m <true/false>
3. Please use device Scope ID, Device ID and Primary Key obtained from previous step. Pass the value of argument ‘m’ per the table below:
| RBD RI Installation Mode | Value |
|---|---|
| Development Mode | true (default) |
| Production Mode | false |
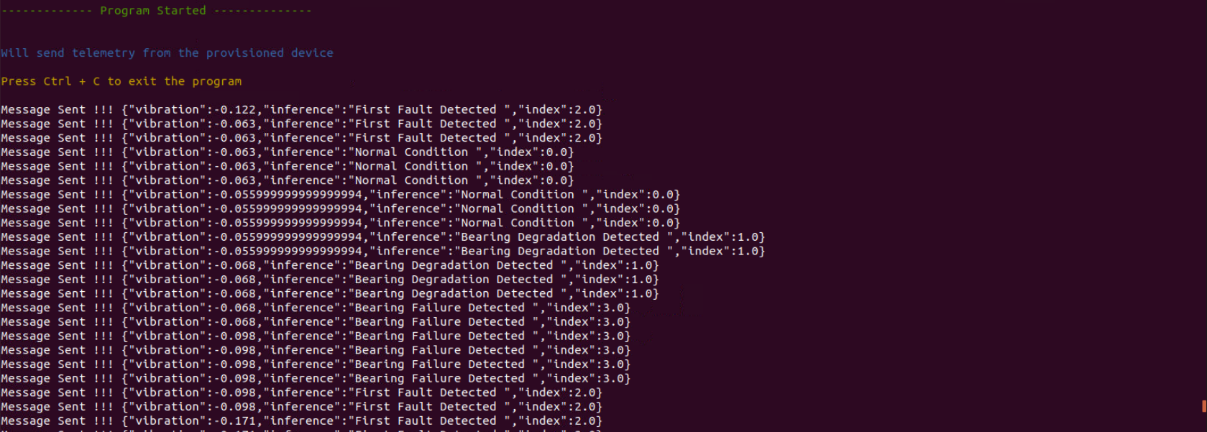
NOTE: You can run the reference implementation in parallel to send live data.
The same script can be used with similar reference implemenations for sending data from InfluxDB to Azure IoT Central with slight modifications in Python script and device template.
Step 6: Monitor Data in Azure IoT Central Dashboard
1. Go to your Azure IoT Central dashboard.
2. Navigate to Devices and choose the device template you created for RBD.

3. Click your device, then click the View tab to display channel-wise telemetry data in the dashboard as shown in the following image. The Inference Result displays the current condition based on the vibration data.
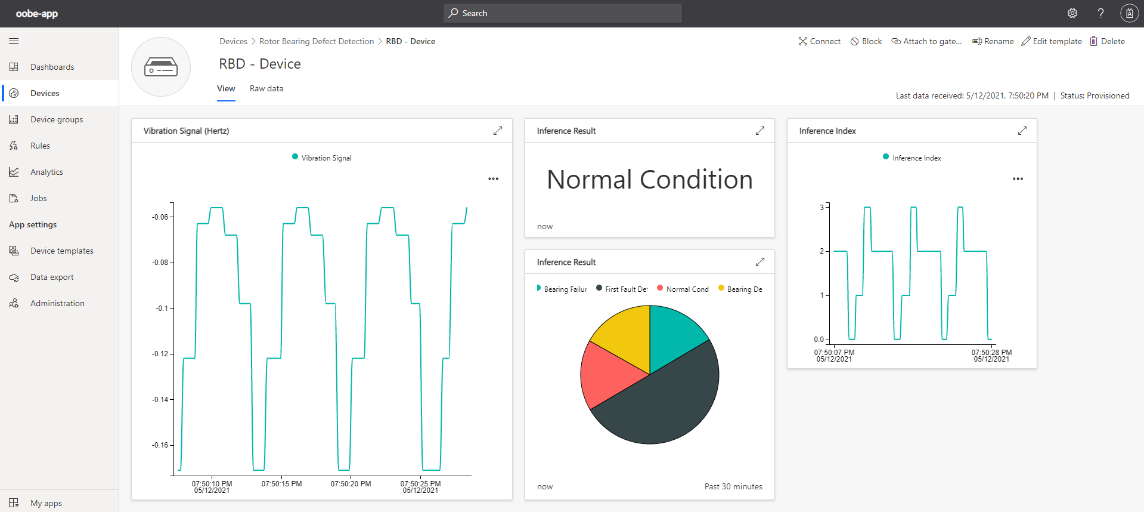
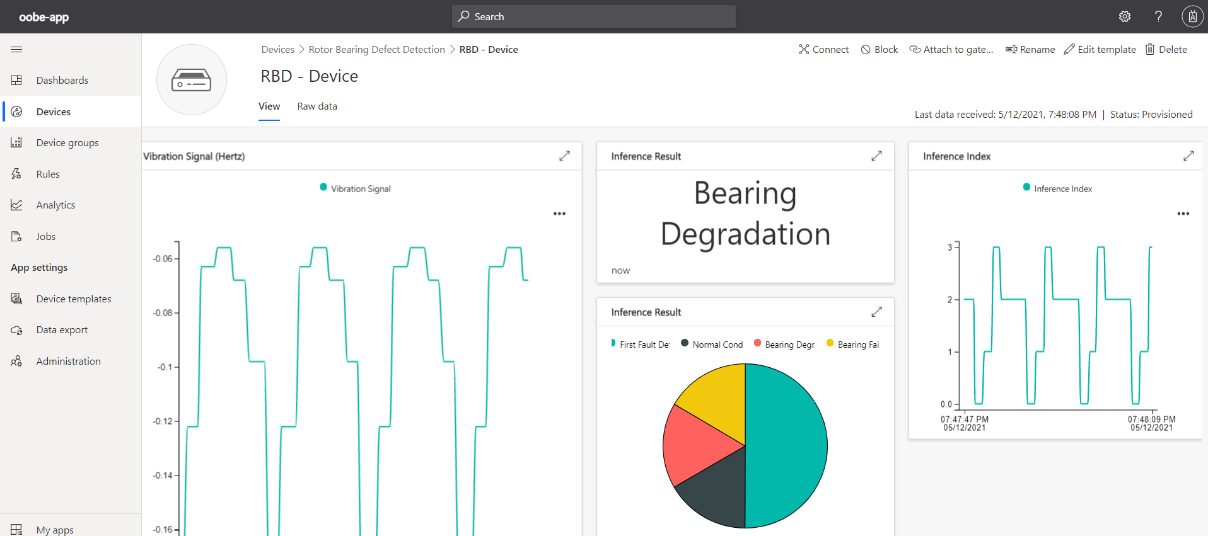
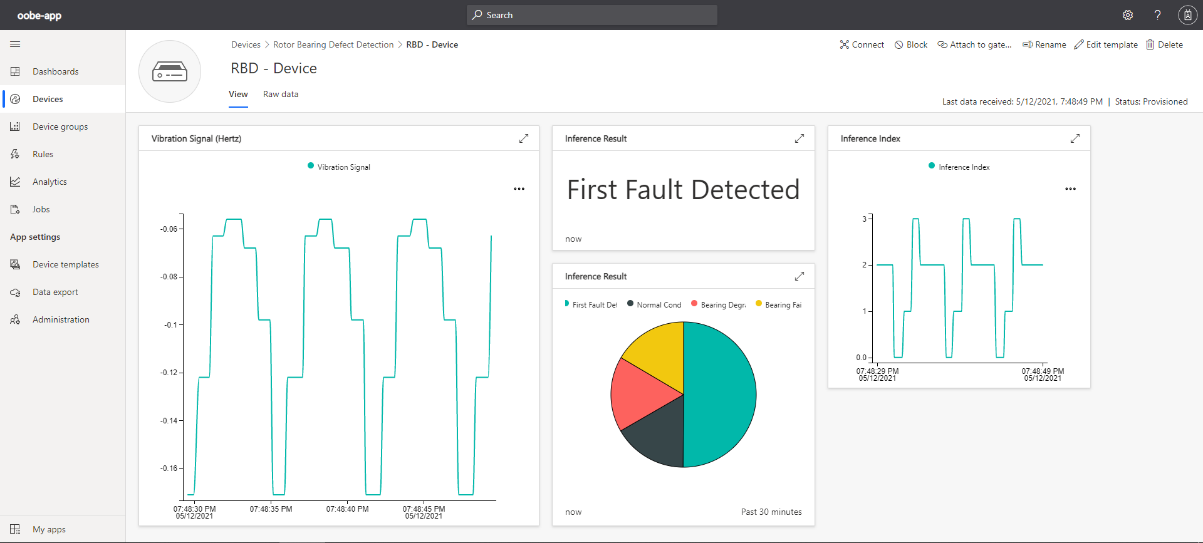
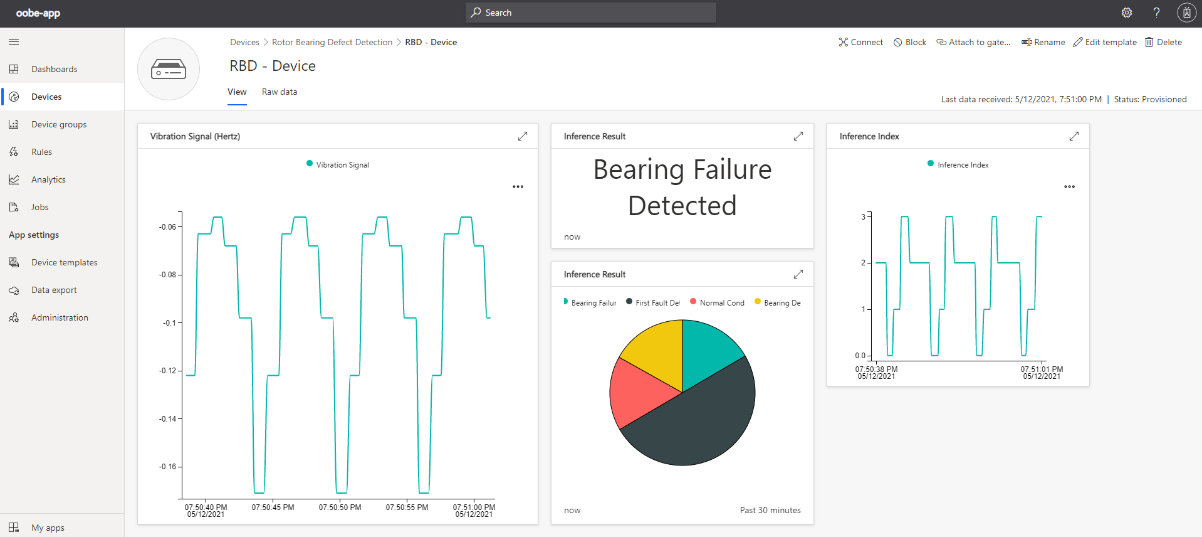
Step 7: Data Analytics in Azure IoT Central Dashboard
In following series of steps, you will use analytics to analyze device data.
- Go to your Azure IoT Central dashboard.
- Navigate to Analytics.
- Choose the device group (RBD device template name) from drop down list that contains devices you want to analyze.
- Under telemetry section, choose one of the telemetry (Vibration Signal/Inference Result/Inference Index) from dropdown list.
- Click on Analyze.
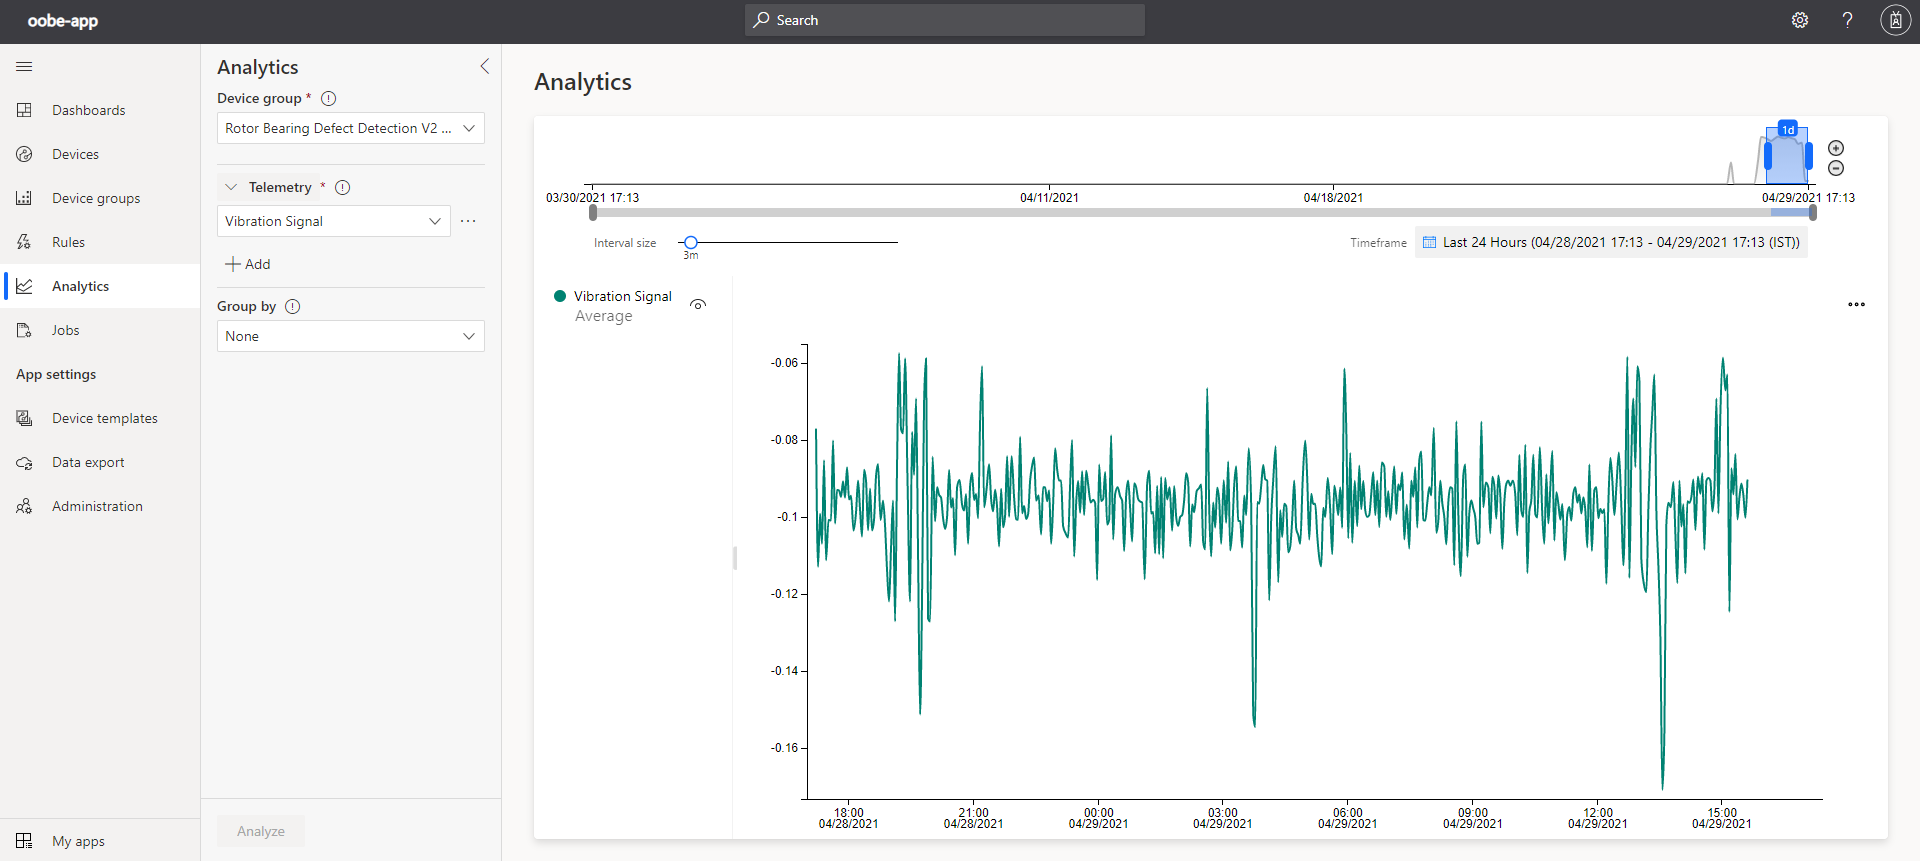
Connect to Azure Time Series Insight
In following series of steps, you are going to export device data to Azure Time Series Insight.
Step 1: Create Azure Event Hub
You can configure an Azure IoT Central application to continuously export telemetry to an event hub. In this section, you create an event hub to receive telemetry from your Azure IoT Central application.
- To create an Azure Event Hub namespace, please follow the instructions (Only create event hub namespace) at Create an Event Hubs Namespace.
- In the Azure portal, navigate to your Event Hubs namespace and select + Event Hub.
- Name your event hub rbd-hub.
- In the list of event hubs in your namespace, select rbd-hub.
- Then choose Shared access policies.
- Select + Add. Create a policy named rbdPolicy with the Manage claims.
- When the policy is ready, select it in the list, and then copy the Connection string-primary key value.
- Make a note of this connection string; you use it later when you export data from Azure IoT Central.
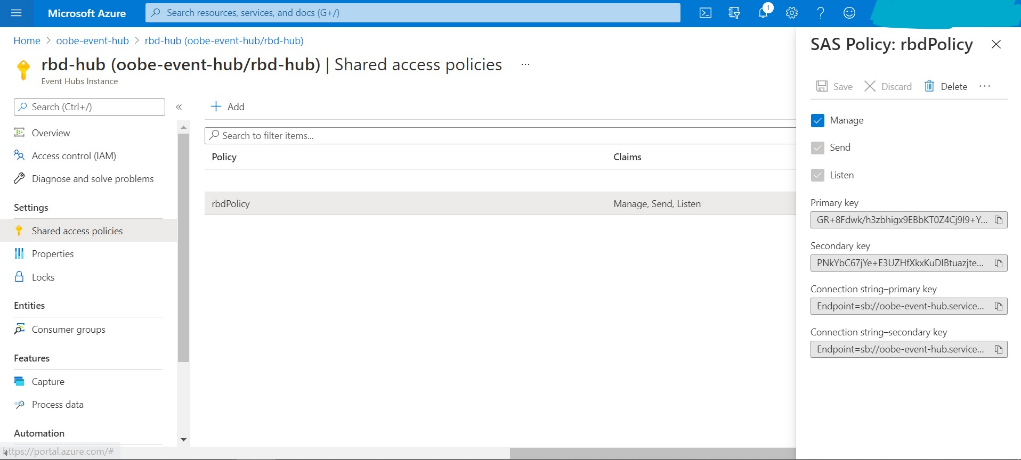
Step 2: Exporting Data to Event Hub
In following series of steps, you will use analytics to analyze device data.
1. Navigate to the Data export page, then select Destinations.
2. Select + New destination.
3. Use the values in the following table to create a destination:
| Settings | Value |
|---|---|
| Destination name | RBD Event Hub |
| Destination type | Azure Event Hubs |
| Connection string | The event hub connection string you made a note of previously |
4. Select Save.
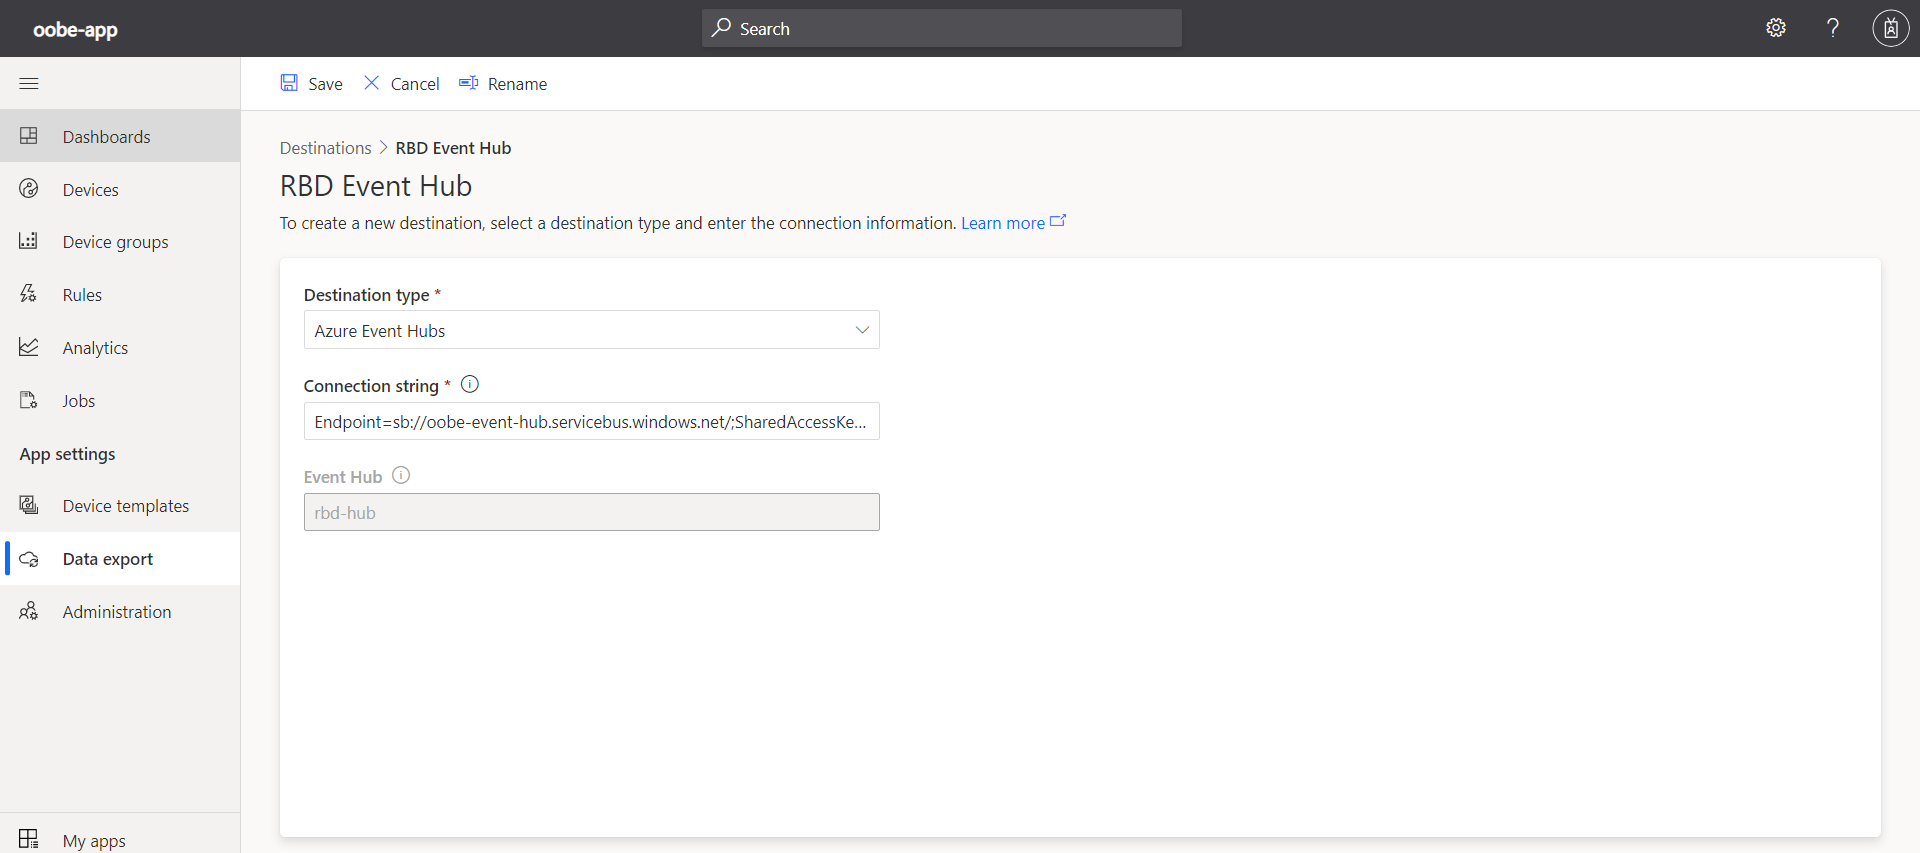
5. To create the export definition:
- Navigate to the Data export page and select + New Export.
- Use the values in the following table to configure the export:
| Settings | Value |
|---|---|
| Export Name | RBD Event Hub Export |
| Enabled | On |
| Type of data to export | Choose Telemetry and then select +Filter and select below values:
|
| Destinations | Select +Destination, then select RBD Event Hub |
6. Select Save.
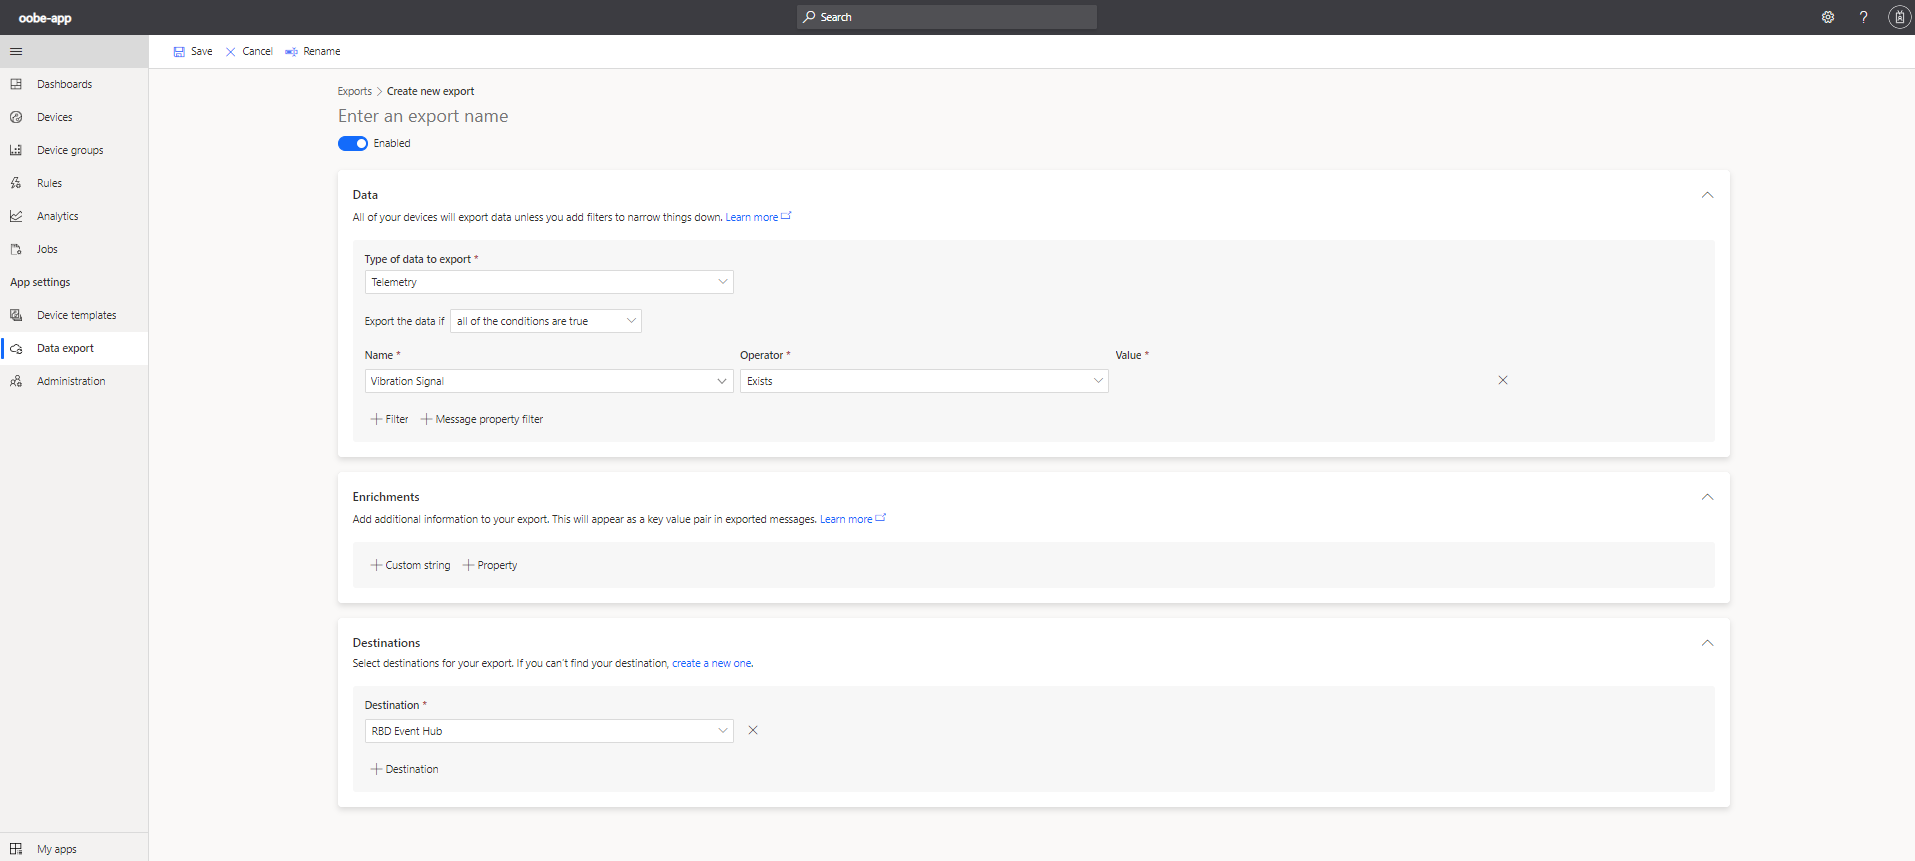
Step 3: Create a Time Series Insight Environment
Follow these steps to create an environment:
- Sign in to the Azure portal.
- Click on Create a resource.
- Type Time Series Insights in the Search box and press Enter, then click on Create button.
- In the Subscription dropdown, you should already have one subscription selected.
- In the Resource group dropdown, select the resource group.
- In the Environment name field, specify a unique name.
- In the Location dropdown, select the location closest to you.
- In the Tier dropdown, select Gen 1(S1) to use Time Series Insights V1.
- Click on Next: Event Source.
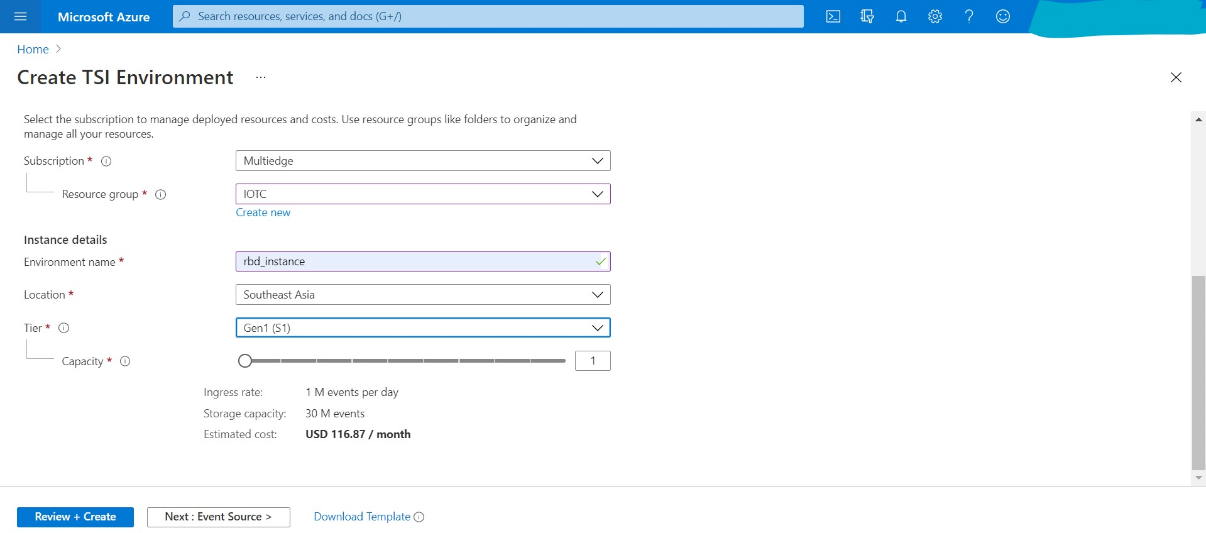
We'll now configure the data source used by Time Series Insights to populate the database. On Event Source tab of the Create Time Series Insights environment, do the following:
- In the Source type selector, Select Event Hub.
- In the Name field, type a unique name.
- In the Subscription dropdown, leave the default Subscription.
- In the Event Hub namespace dropdown, select the Event Hub namespace created at the previous step
- In the Event Hub name dropdown, select the Event Hub created at the previous step (rbd_hub).
- In the Event Hub access policy name dropdown, select rbdPolicy.
- In the Event Hub consumer group dropdown, Click on Add and provide a new to consumer group.
- Click on Review + Create.
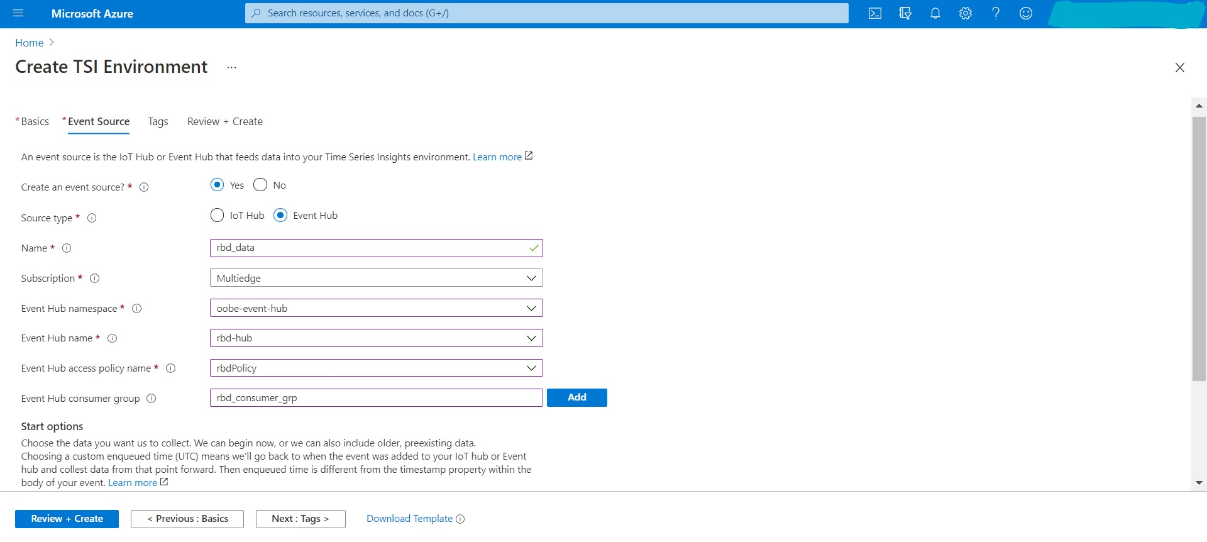
Deployment of Time Series Insights will take a couple of minutes to complete.
Step 4: Monitoring Data in Time Series Insights Explorer
1. In the search box at the top of the portal, type Time Series Insights and click on the appropriate result in the Services category.
2. Click on the name of your Time Series Insights environment you've created in the previous unit.
3. In the Time Series Insights page, click on Go to TSI Explorer button at the top. Your browser will now open a new window with Time Series Insights main page.
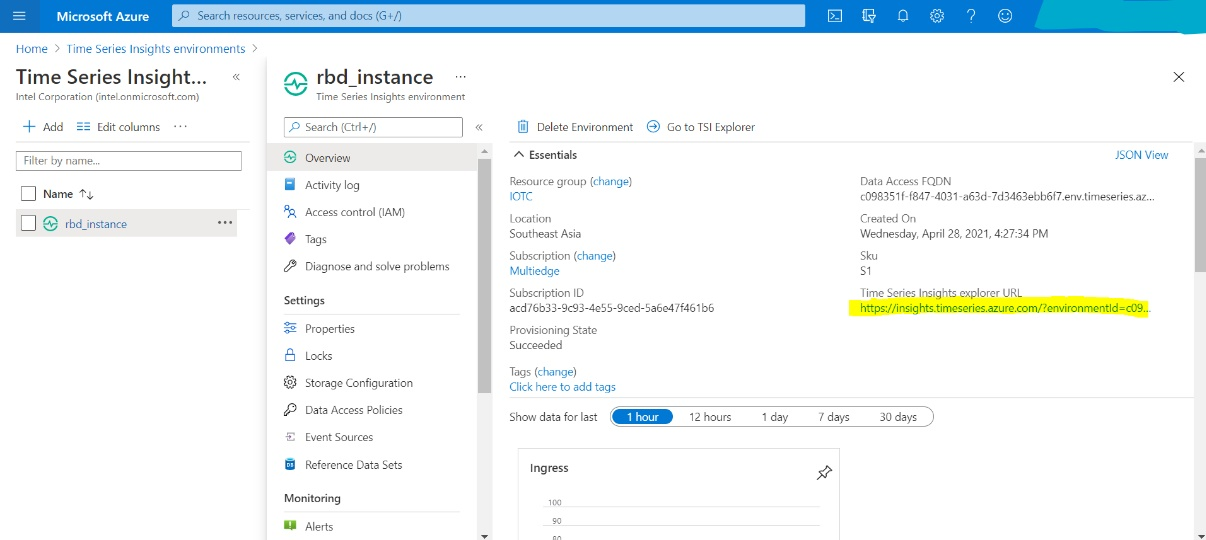
4. In Explorer dashboard, navigate to Analyze tab and enable Auto Refresh.
5. Click on Add new query.
6. In Measure dropdown, select telemetry.vibration or telemetry.index. Now your time series data will start getting populated in dashboard.
To learn more, you can add Out-of-Band Manageability functionality to your reference implementation.
Known Issues
Production Mode Security Warnings
Issue with Grafana Visualization
In Production Mode, security risk warning will be displayed when navigating to Grafana dashboard via https://localhost:3000. To visualize data in Grafana, please navigate to https://127.0.0.1:3000 to avoid receiving warnings.
Insecure Request Warning
On running connect.sh in Production Mode, Insecure Request Warnings will be printed on terminal window. The script is provided for reference purpose only. Update it to meet your needs.
Map UI and Inferencing video not rendering on EFLOW
Intel® GPU enablement is not yet available. Instructions will be added once the support is available.
Unable to view Map UI and inference video in Grafana dashboard and flask server. The Smart City module is unable to host video server on EFLOW VM IP.

Summary and Next Steps
You have successfully installed the Connect Intel Devices to Azure IoT* web application, and connected to Azure IoT Hub and Azure IoT Central.
You have also successfully installed and visualized some of the sample applications through Azure IoT Central dashboard.
Learn More
To continue learning, refer to these sites for details on Azure Portal, Azure IoT Hub, Azure IoT EFLOW, and Azure IoT Central.
Support Forum
If you're unable to resolve your issues, contact the Support Forum.
†You are responsible for payment of all third-party charges, including payment for use of Microsoft Azure services.
For the most up-to-date information on Microsoft® Azure products, see the Microsoft Azure website.