Visible to Intel only — GUID: zka1520557944487
Ixiasoft
A.1. Modify the Intel® Stratix® 10 SX SoC Development Kit to use a battery for the BBRAM
A.2. Modify the Intel® Stratix® 10 SX SoC Development Kit HPS DDR4 memory width and ECC configuration using the Golden Hardware Reference Design project
A.3. Safety and Regulatory Information
A.4. Compliance Information
Visible to Intel only — GUID: zka1520557944487
Ixiasoft
5.3.9. Power Monitor
The Power Monitor measures and reports current power information and communicates with the Intel® MAX® 10 device on the board through the JTAG bus. A power monitor circuit attached to the Intel® MAX® 10 device allows you to measure the power that the FPGA is consuming.
To start the application, click the Power Monitor icon in the BTS. You can also run the Power Monitor as a stand-alone application. The PowerMonitor.exe resides in the <packagedir>\examples\board_test_system directory.
Note: You cannot run the stand-alone power application and the BTS simultaneously. Also, you cannot run power and clock interface at the same time.
Figure 43. Power Monitor
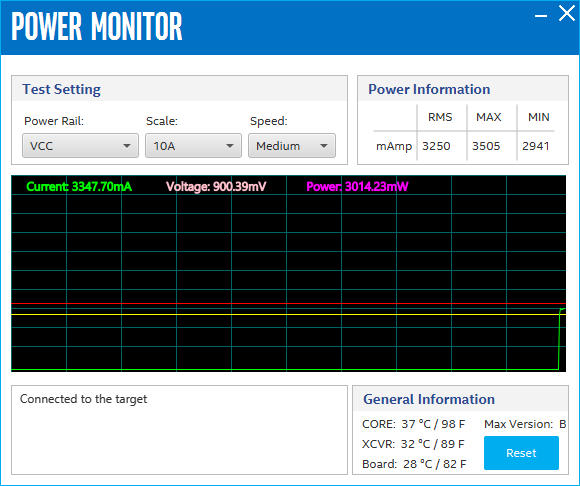
The controls on the Power Monitor are described below.
Test Settings
Displays the following controls:
- Power Rails: Indicates the currently selected power rail. After selecting the desired rail, click Reset to refresh the screen with updated board readings.
- Scale: Specifies the amount to scale the power graph. Select a smaller number to zoom-in to see finer detail. Select a larger number to zoom-out to view the entire range of recorded values.
- Speed: Specifies how often to refresh the power graph.
Power Information
Displays the root mean square (RMS) current, maximum and minimum numerical power readings in mA.
Graph
Displays the mA power consumption of your board over time. The green line indicates the current value. The red line indicates the maximum value read since the last reset. The yellow line indicates the minimum value read since the last reset.
General Information
Displays the MAX V version and current temperature of the FPGA and the board.
Reset
Clears the graph, resets the minimum and maximum values and restarts the Power Monitor.