Visible to Intel only — GUID: jcr1499727205883
Ixiasoft
A.1. Modify the Intel® Stratix® 10 SX SoC Development Kit to use a battery for the BBRAM
A.2. Modify the Intel® Stratix® 10 SX SoC Development Kit HPS DDR4 memory width and ECC configuration using the Golden Hardware Reference Design project
A.3. Safety and Regulatory Information
A.4. Compliance Information
Visible to Intel only — GUID: jcr1499727205883
Ixiasoft
5.3.3. The QSFP/SFP Tab
This tab allows you to perform loopback tests on the QSFP and SFP ports.
Figure 36. The QSFP/SFP Tab
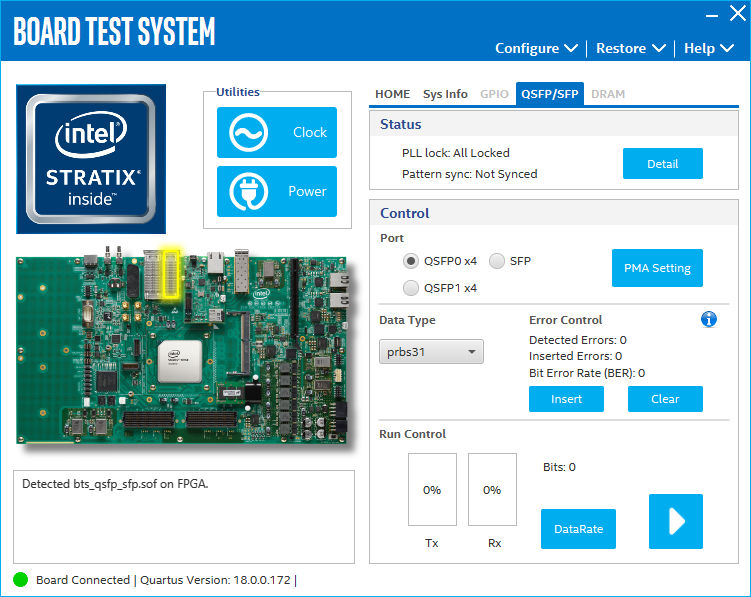
The controls on this tab are described below.
Status
Displays the following status information during a loopback test:
- PLL Lock: Shows the PLL locked or unlocked state.
- Pattern Sync: Shows the pattern synced or not synced state. The pattern is considered synced when the start of the data sequence is detected.
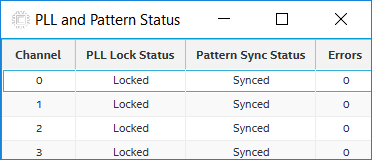
- Details: Shows the PLL lock and pattern status.
Figure 37. PLL and Pattern Status
Port
Allows you to specify which interface to test. The following port tests are available:
- QSFP0 x4
- QSFP1 x4
- SFP x1
PMA Setting
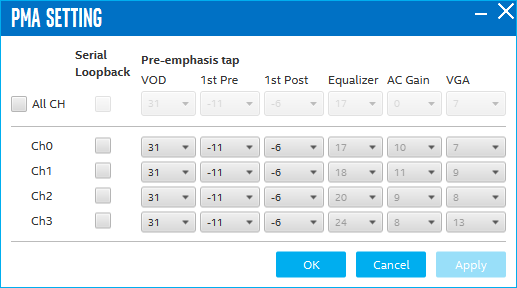
Allows you to make changes to the PMA parameters that affect the active transceiver interface. The following settings are available for analysis.
Serial Loopback: Routes signals between the transmitter and the receiver.
VOD: Specifies the voltage output differential of the transmitter buffer.
Pre-emphasis tap
- 1st pre: Specifies the amount of pre-emphasis on the first pre-tap of the transmitter buffer.
- 1st post: Specifies the amount of pre-emphasis on the first post-tap of the transmitter buffer.
Equalizer: Specifies the CLTE EQ Gain for the receiver.
AC Gain: Specifies the CLTE AC Gain for the receiver.
VGA: Specifies the VGA Gain for the receiver.
Data Type
Specifies the type of data contained in the transactions. The following data types are available for analysis.
- PRBS 7: Selects pseudo-random 7-bit sequences
- PRBS 15: Selects pseudo-random 15-bit sequences
- PRBS 23: Selects pseudo-random 23-bit sequences
- PRBS 31: Selects pseudo-random 31-bit sequences
- HF: Selects highest frequency divide-by-2 data pattern 10101010
- LF: Selects lowest frequency divide-by-33 data pattern
Error Control
Displays data errors detected during analysis and allows you to insert errors
- Detected Errors: Displays the number of data errors detected in the hardware.
- Inserted Errors: Displays the number of errors inserted into the transmit data stream.
- Insert: Inserts a one-word error into the transmit data stream each time you click the button. Insert is only enabled during transaction performance analysis.
- Clear: Resets the Detected Error counter and Inserted Errors counter to zero.
Run Control
- TX and RX performance bars: Show the percentage of maximum theoretical data rate that the requested transactions are able to achieve.
- Start: Initiates the loopback tests.
- Tx (Mbps) and Rx (Mbps): Show the number of bytes of data analyzed per second.
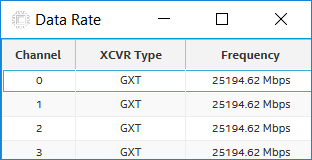
- Data Rate: Shows the data rate for each link.